# Welcome to Loadium

Effective - Innovative - Simple

Got questions about using Loadium or anything related to load testing? This comprehensive guide will walk you through everything, from designing your first load test to analyzing your test results, and the latest technologies available related to load testing.

If you're new to Loadium and you are familiar with load testing, you can check out our Quick Start guide to get things going quickly.

{% content-ref url="/pages/-MUSAoEB7WKUP6OKgxHU" %}
[Quick Start](/creating-your-first-test)
{% endcontent-ref %}

If you're new to load testing, we recommend starting with "**Getting Started With Loadium"**. If you're looking for something in particular, you can use the search function or jump to one of the sections below.

{% content-ref url="/pages/-MUQ5cTQeTV9Yioro2zC" %}
[Getting Started with Loadium](/getting-started)
{% endcontent-ref %}

Happy Testing!


# Getting Started with Loadium

Loadium is designed to be user-friendly, but things sometimes can get complicated. Please read on if you are looking for more information about load testing and Loadium.

## What is Load Testing?

A brief explanation of load testing for beginners.

Let’s say we are an engineer who is to design a bridge. What should we consider when designing this bridge?

First of all, we have to calculate the maximum number of cars that could pass over the bridge and the average weight of these cars. Similarly, in the software world, applications are designed for a specific concurrent user load.

The load test ensures that potential malfunctions in the system are detected and prevented in advance by identifying problems such as delays and enabling page prevention in the system when multiple users access the application.

The purpose of load testing is to maintain system reliability and performance, to ensure the successful operation of the system software, and to ensure that the end user benefits from the system with full efficiency.

## What is Loadium?

Loadium is a 100% domestic product developed by Testinium Inc. R\&D engineers. Its purpose is to simulate demands from heavy loads and disorganized systems, that are close to real user behavior and provide reports instantly. The most important difference from standard products is that the demands requested from a wide network get the closest results to the real demands and the reach loads of millions of demands can be reached.

### How can Loadium help you run your load tests?

First, you need to create an account to be able to use Loadium and its basic features. There are two types of accounts:

* Free Account (free 10 monthly load tests)
* Paid account

To create an account, go to the website.

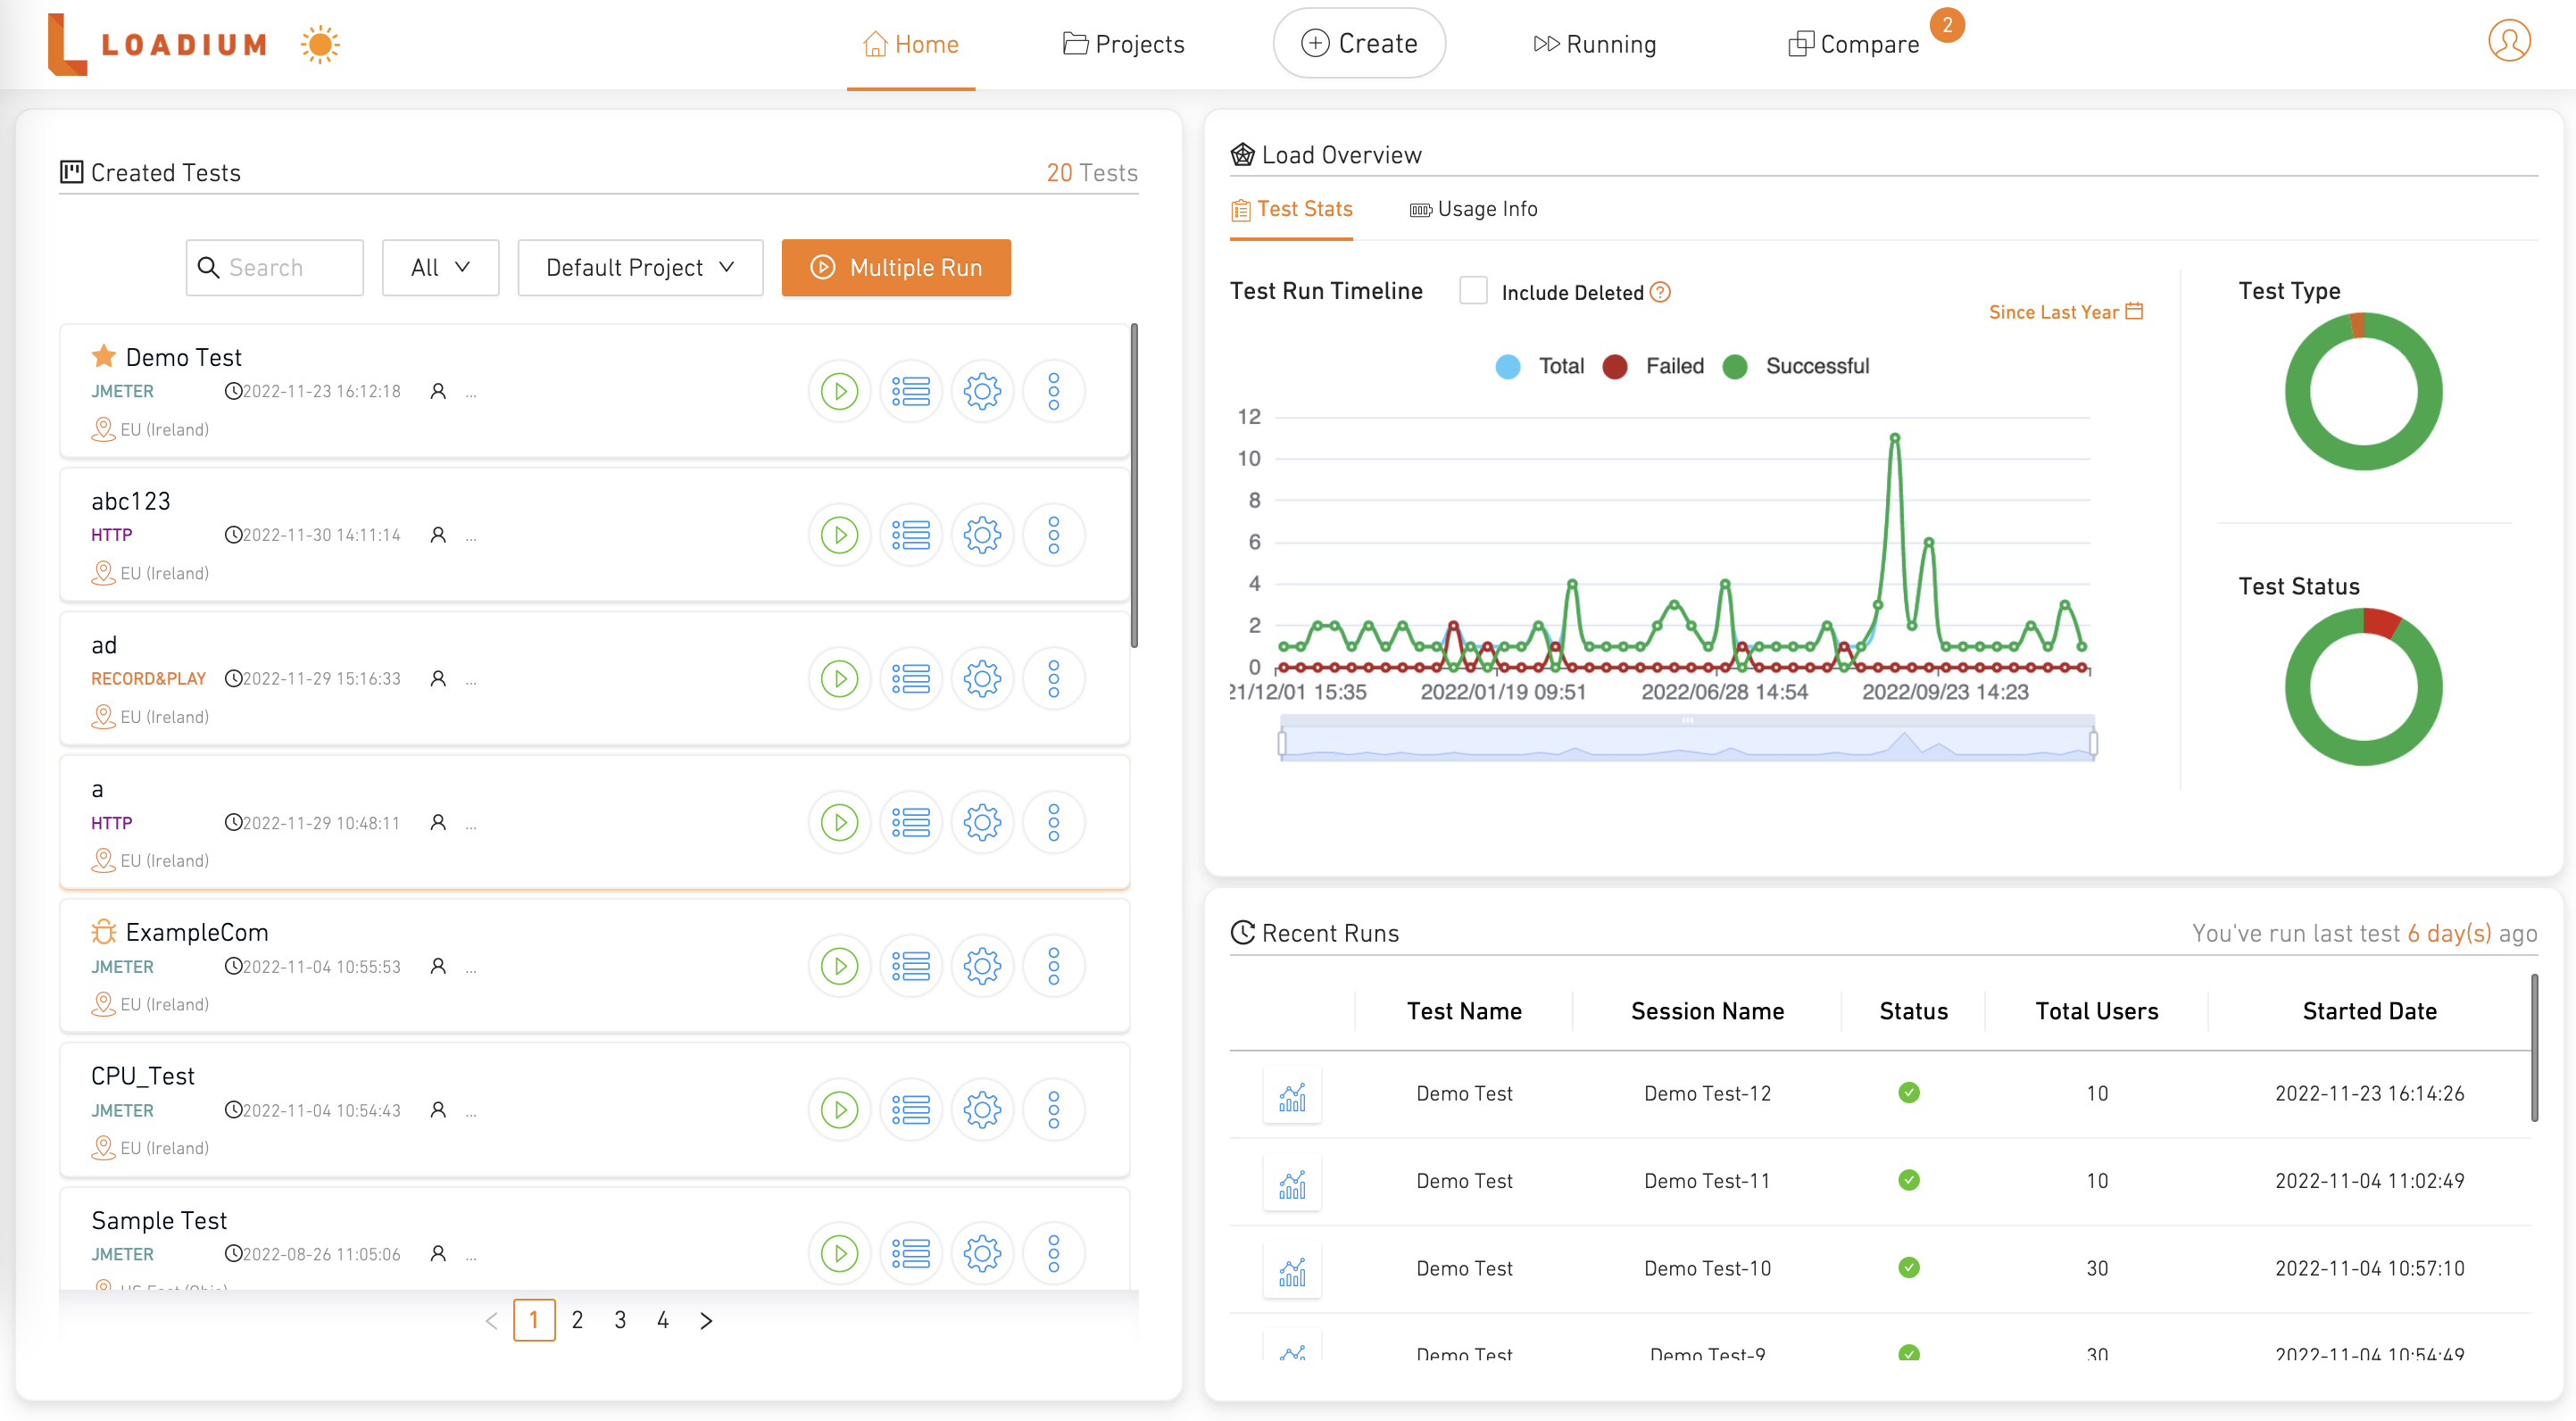
After logging in with valid credentials, you will be greeted with Loadium’s home page.

![](/files/Idgp6CE2Gu2Kd9gWo9RO)

You will be presented with Home Page. There are five tabs in the banner menu:

**1. Home:** Displays the list of the created tests, information for previous test runs, and package usage

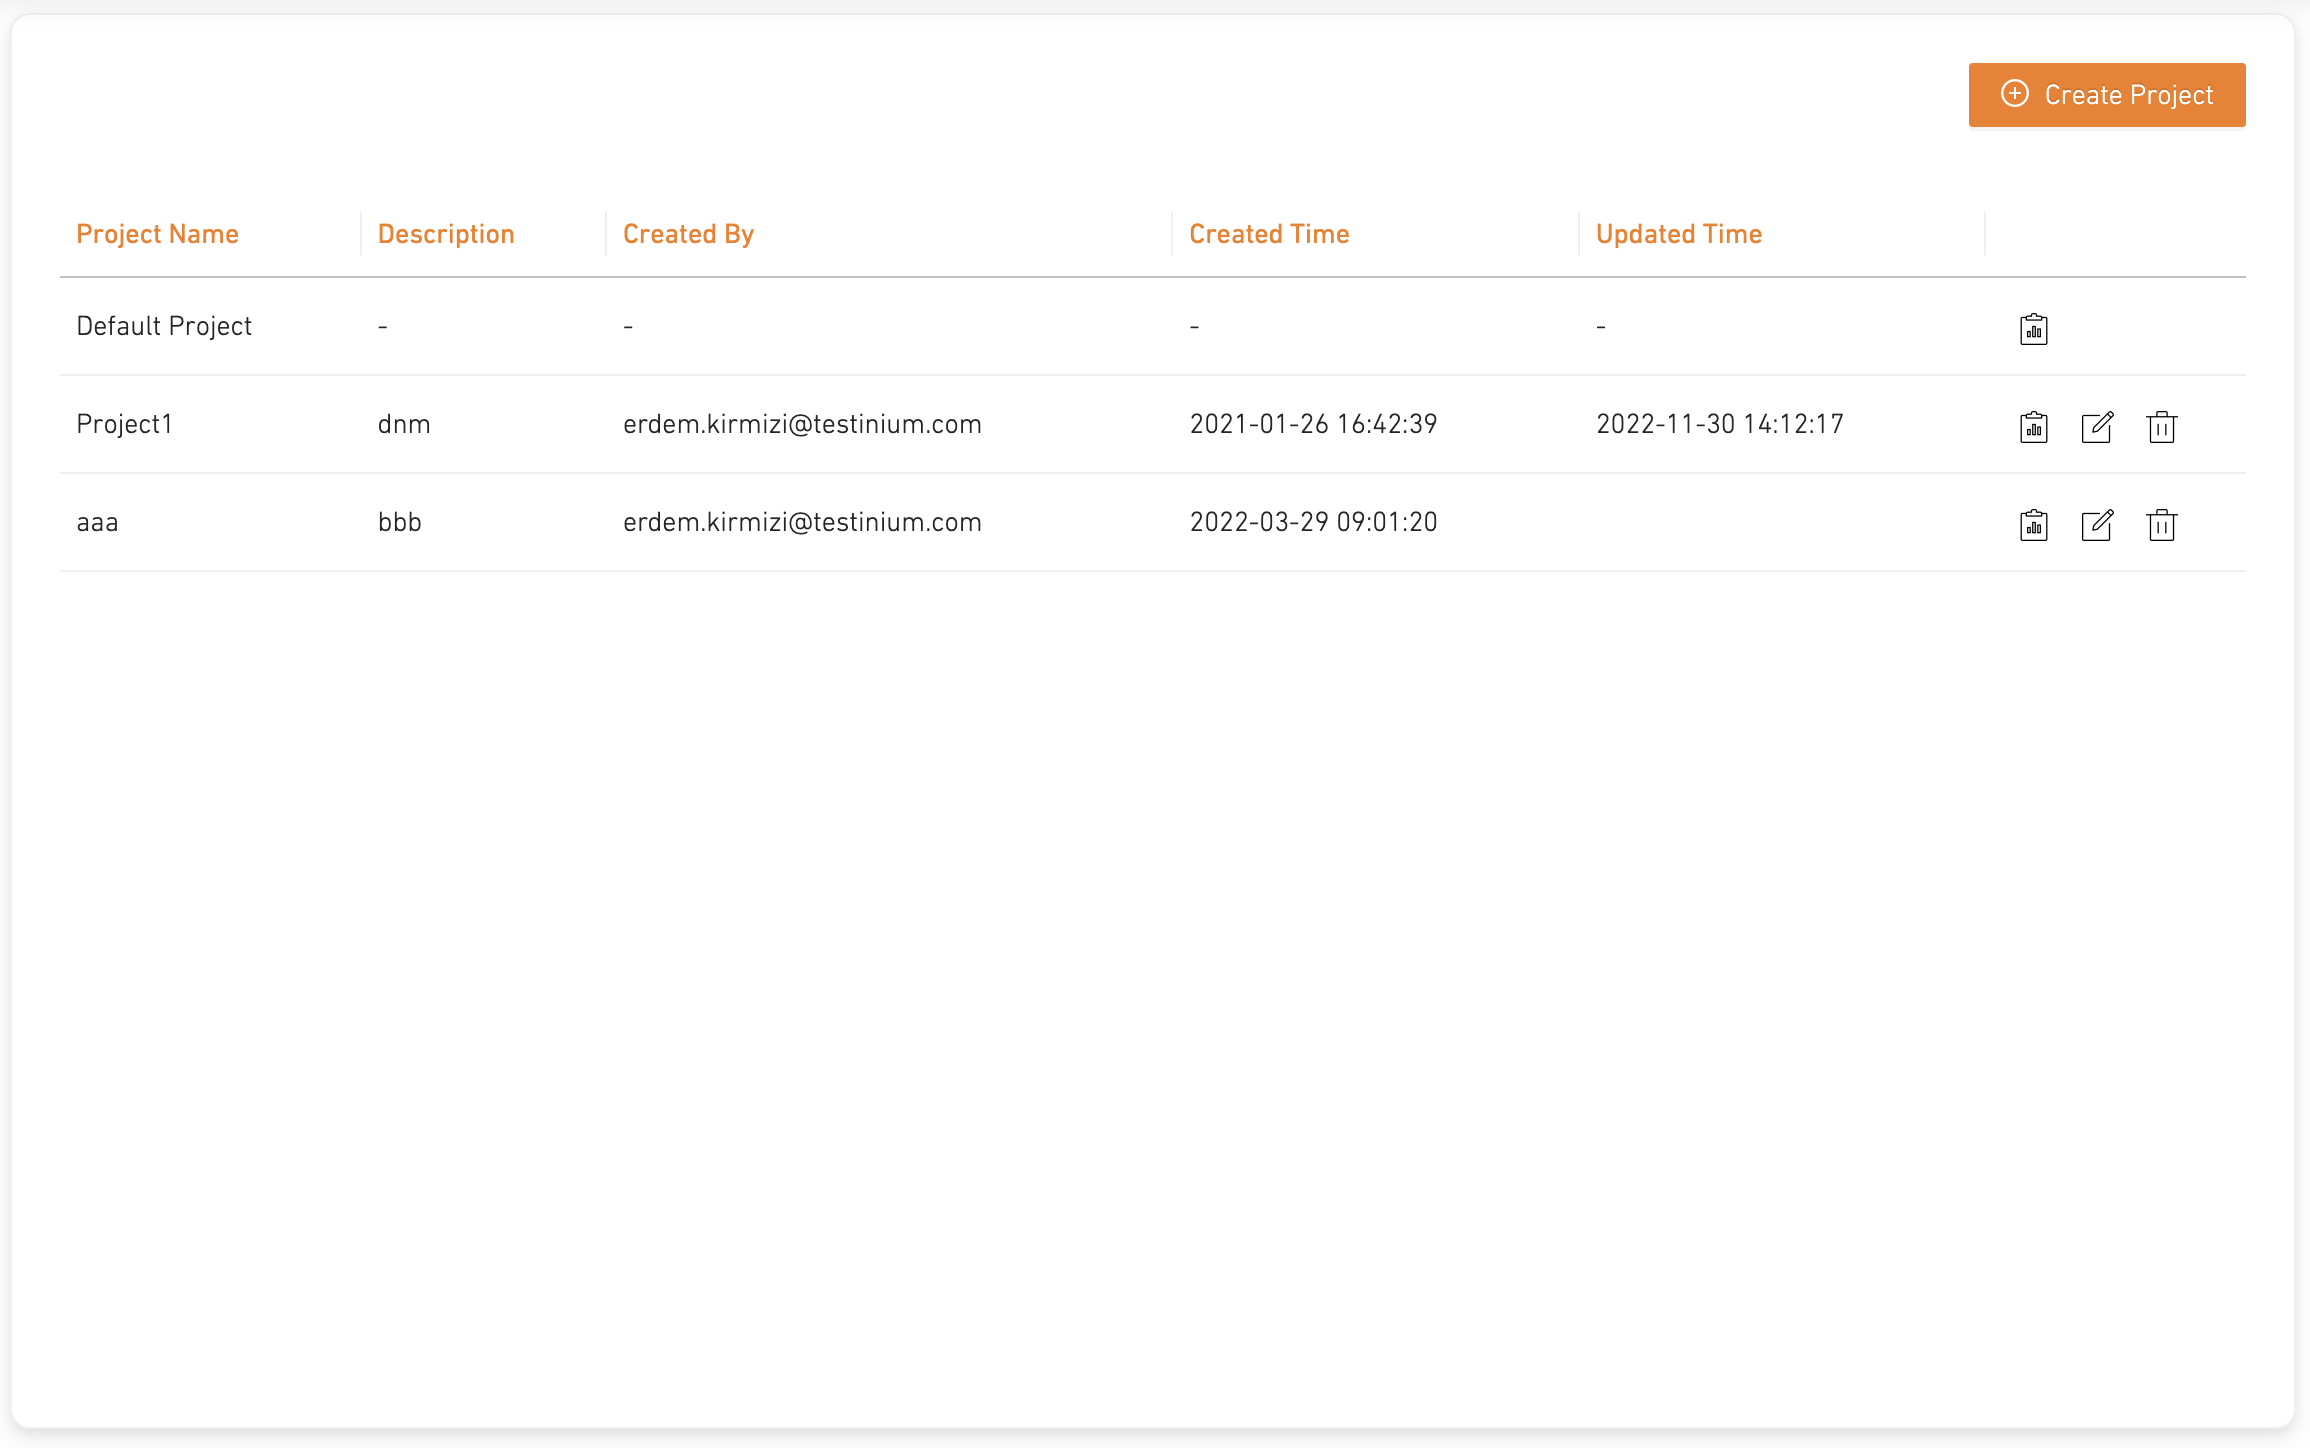
**2. Projects:** Allows grouping of the created tests and displays them.

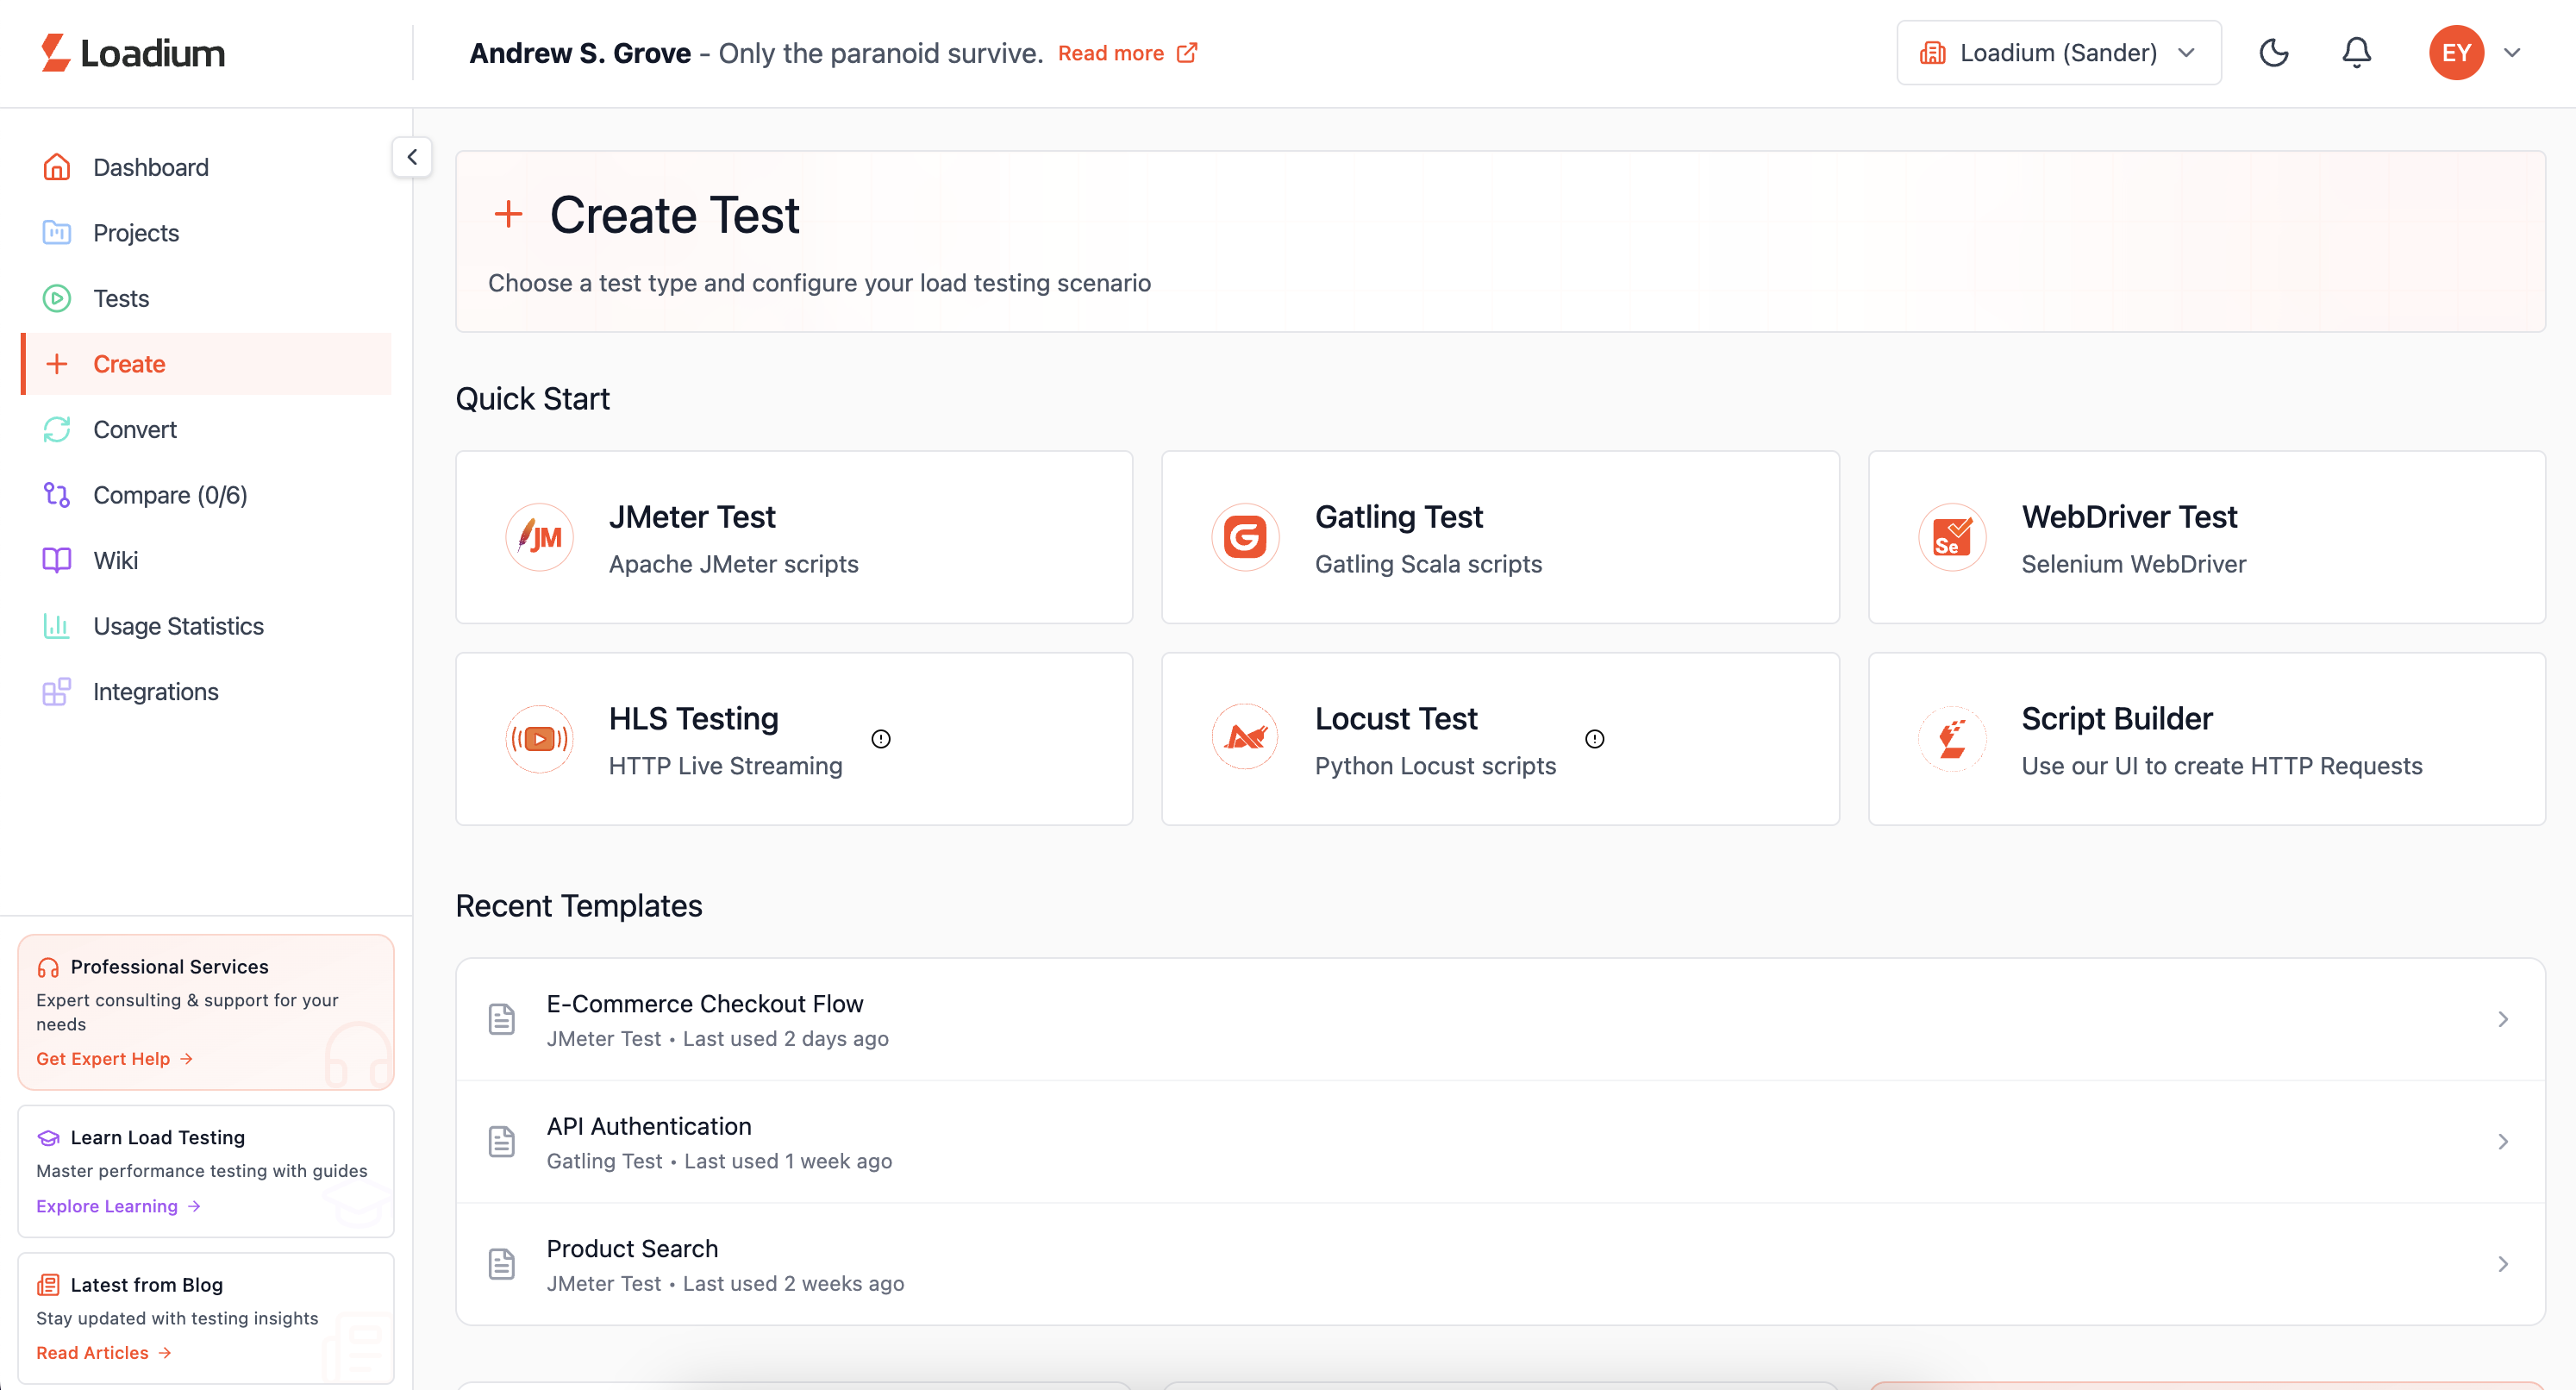
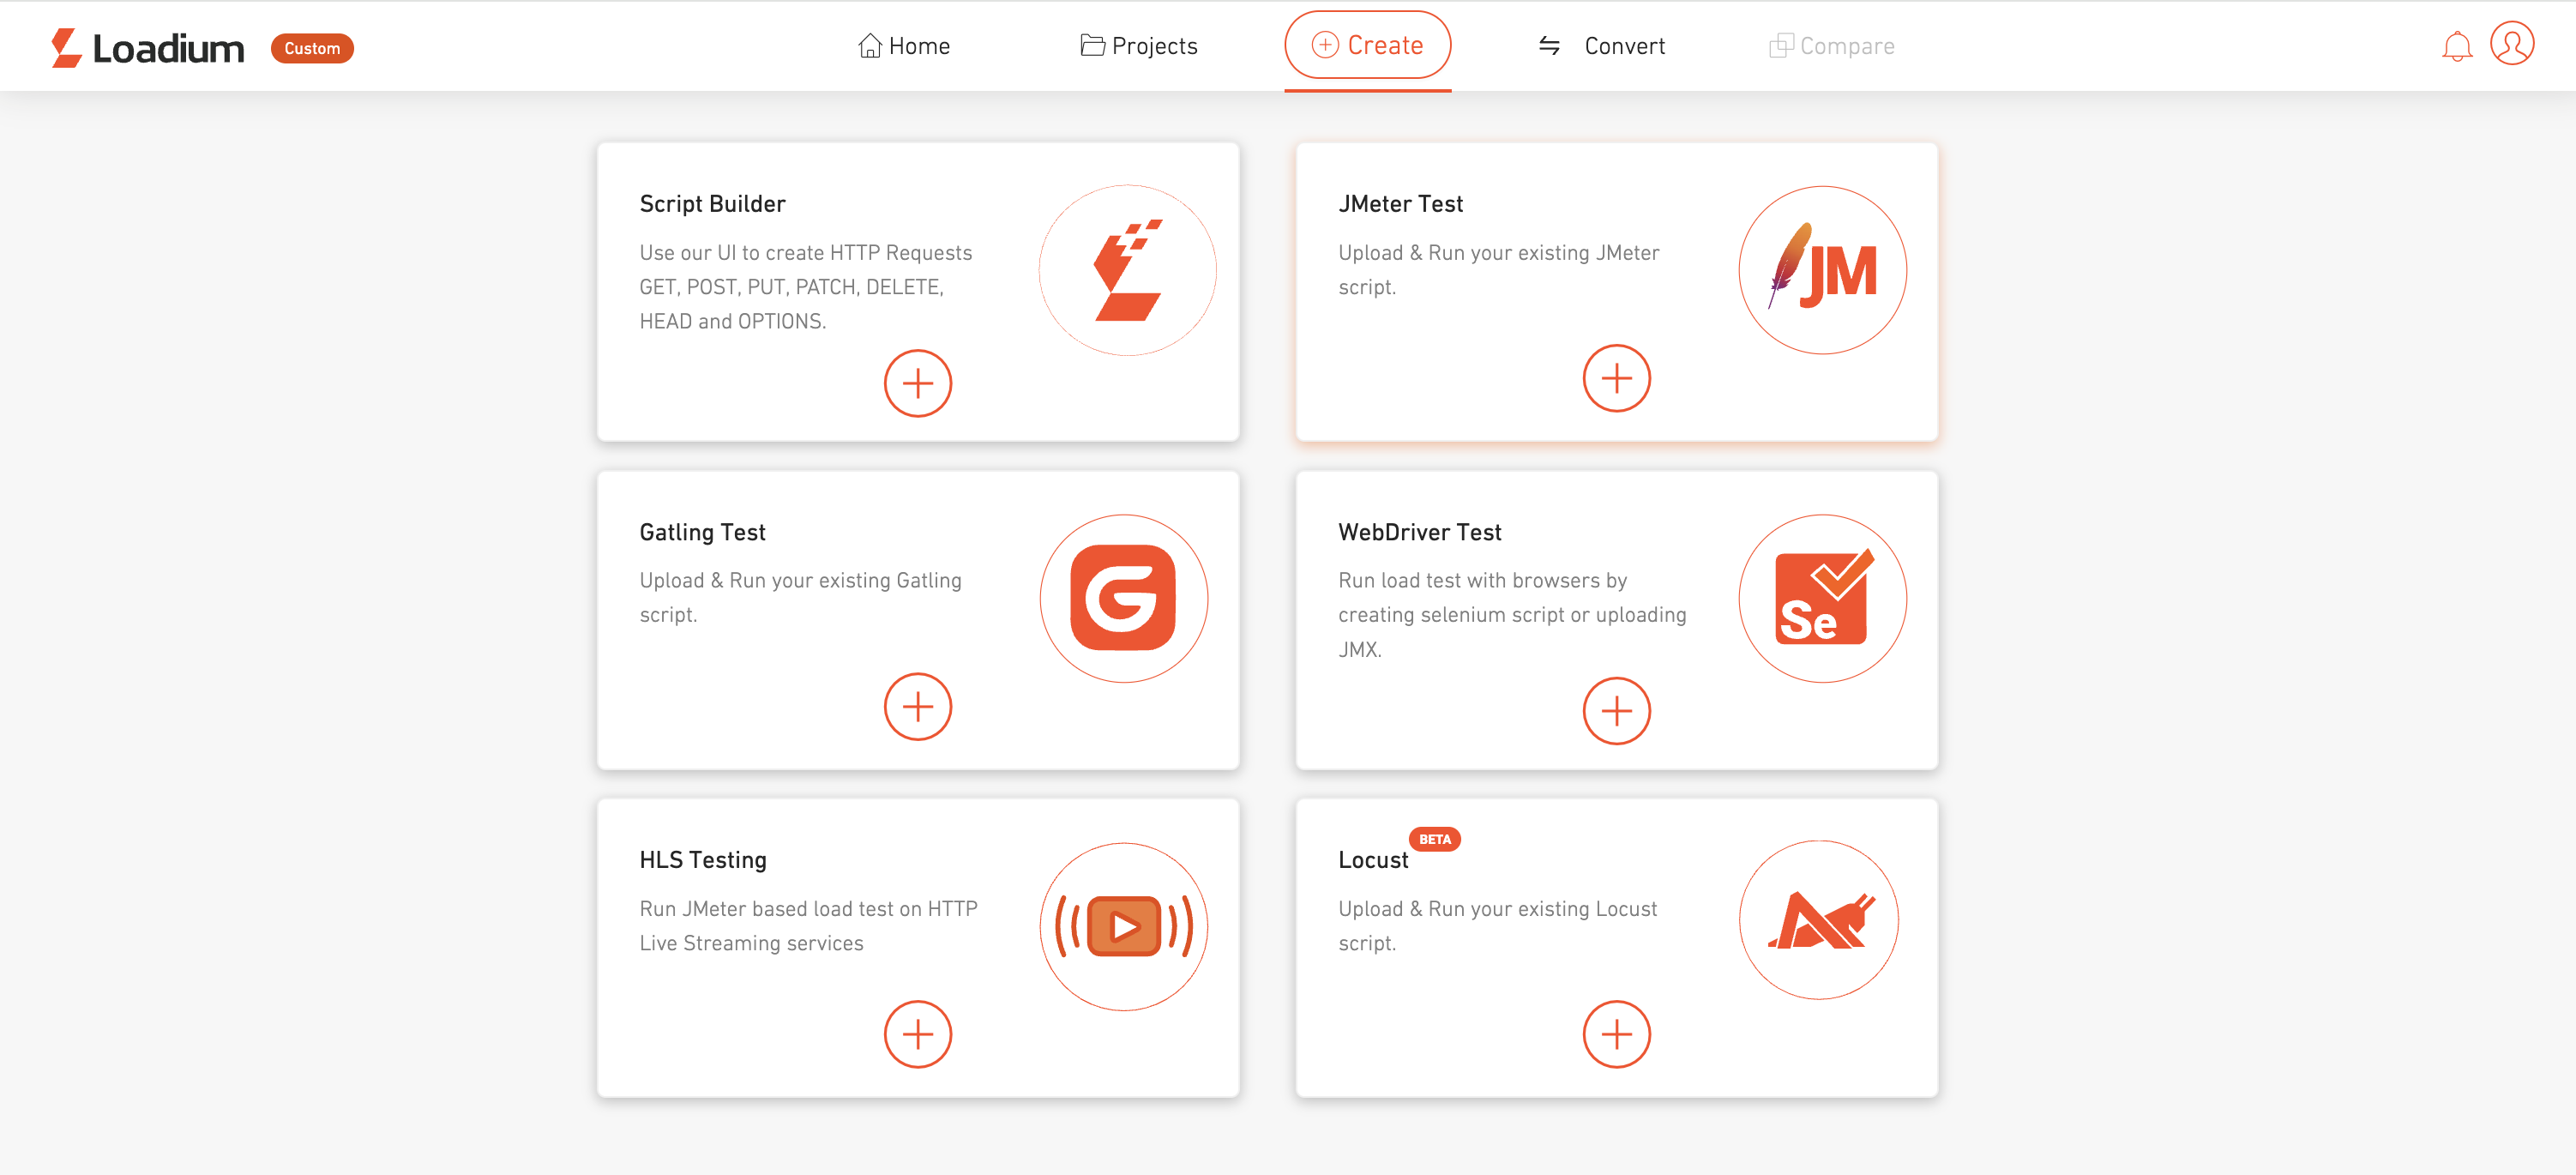
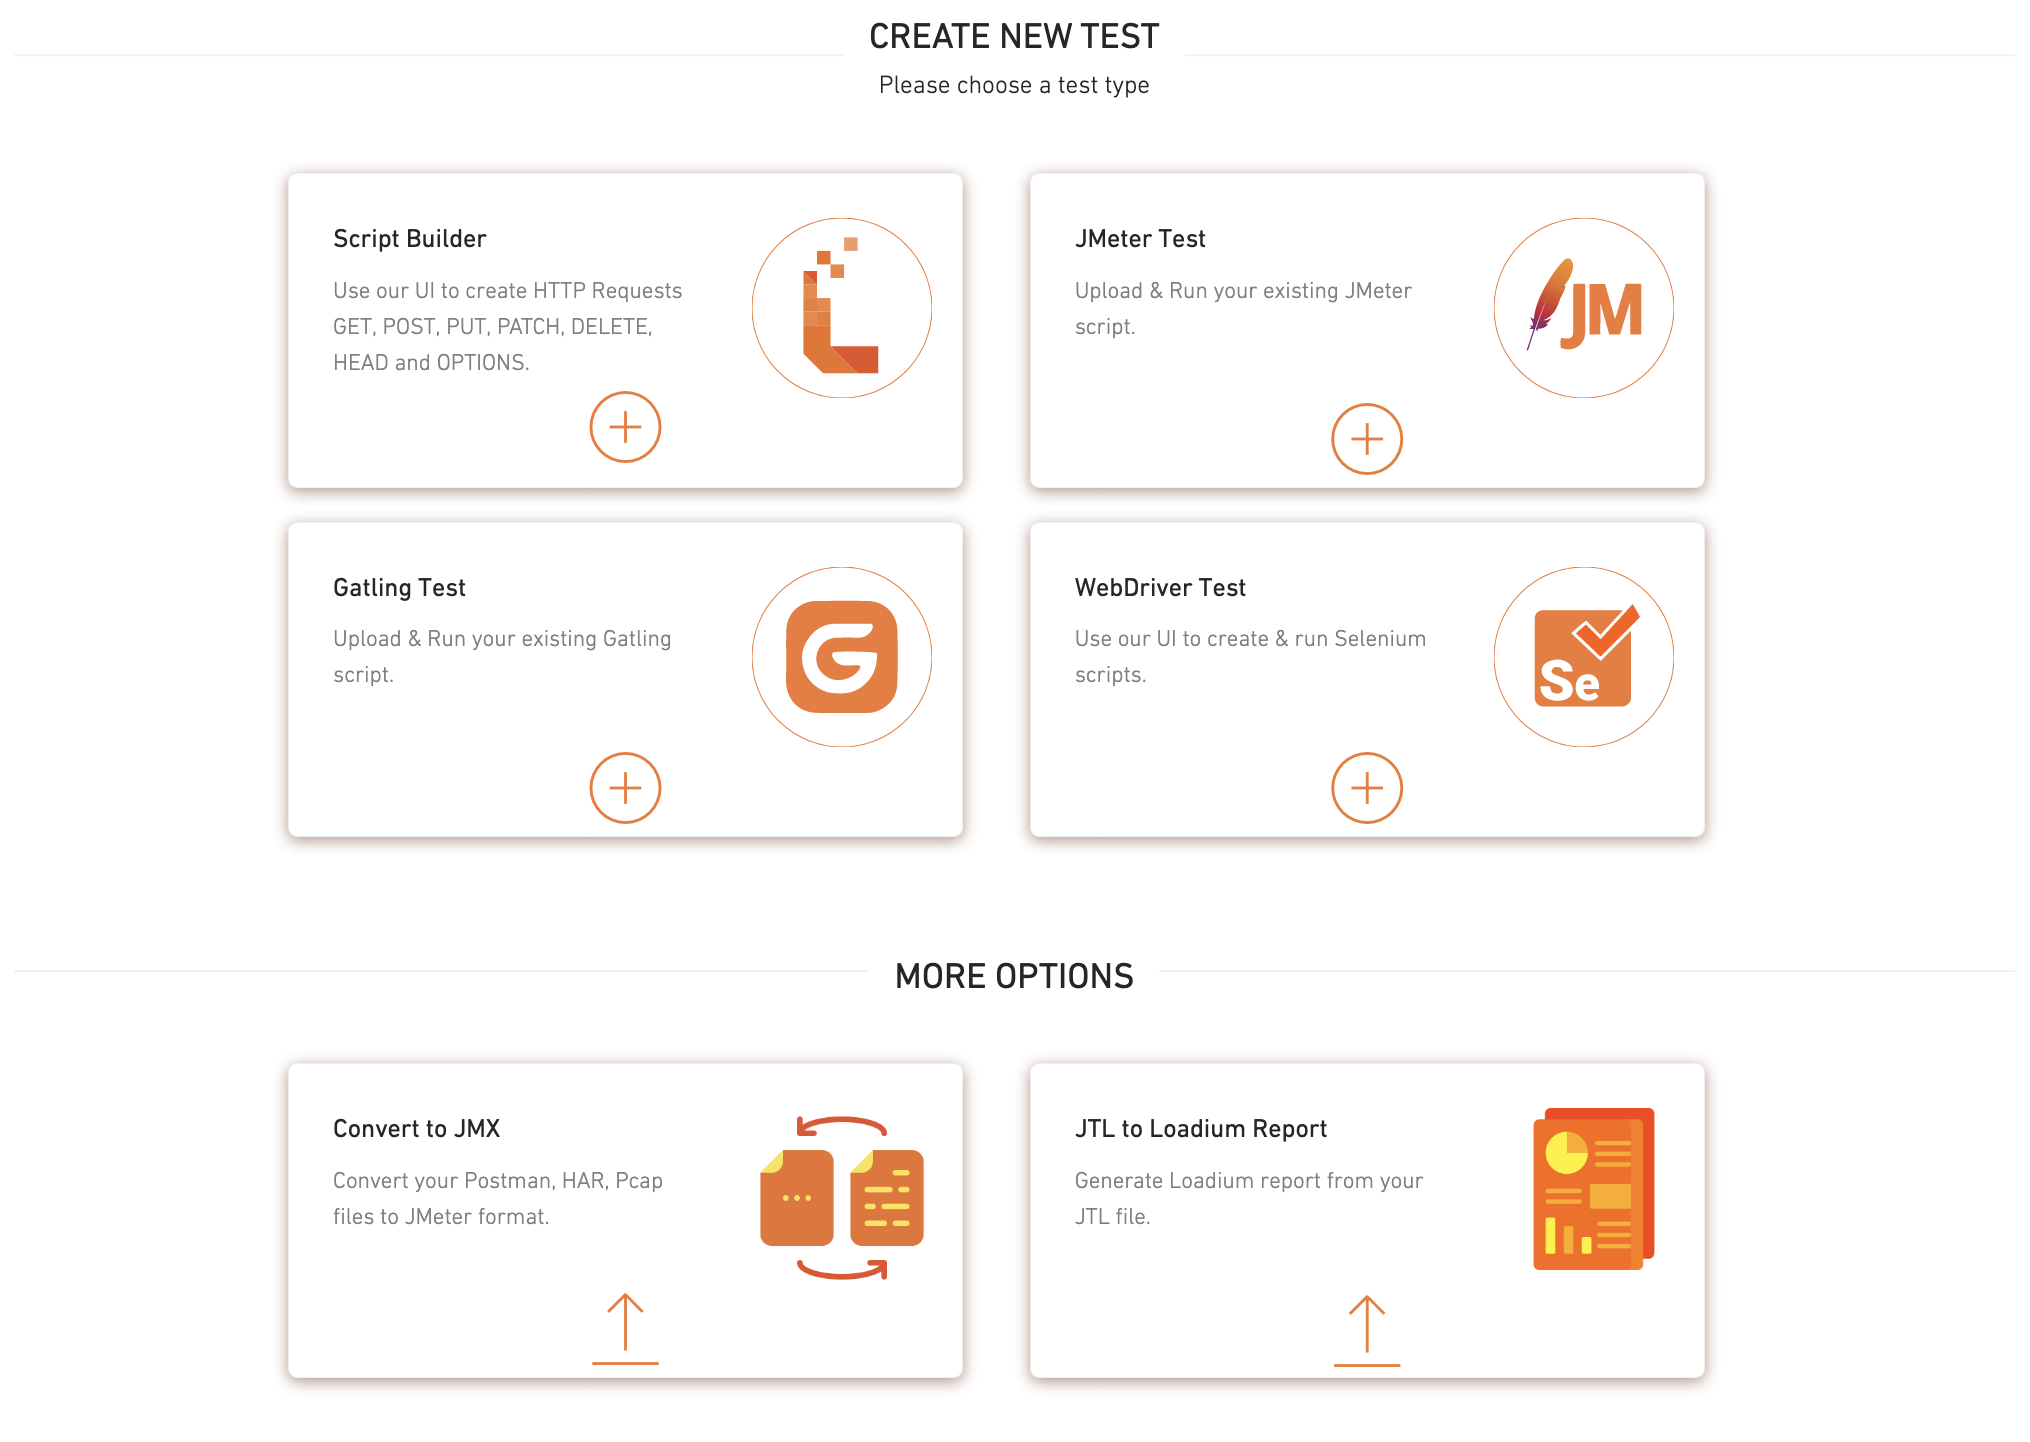
**3. Create:** This option allows you to start creating a test with Script Builder, JMeter file, Gatling file, Selenium WebDriver editor, and also presents other options Convert to JMX and JTL to Loadium Report.

**4. Running Test:** This option shows your actively running tests.

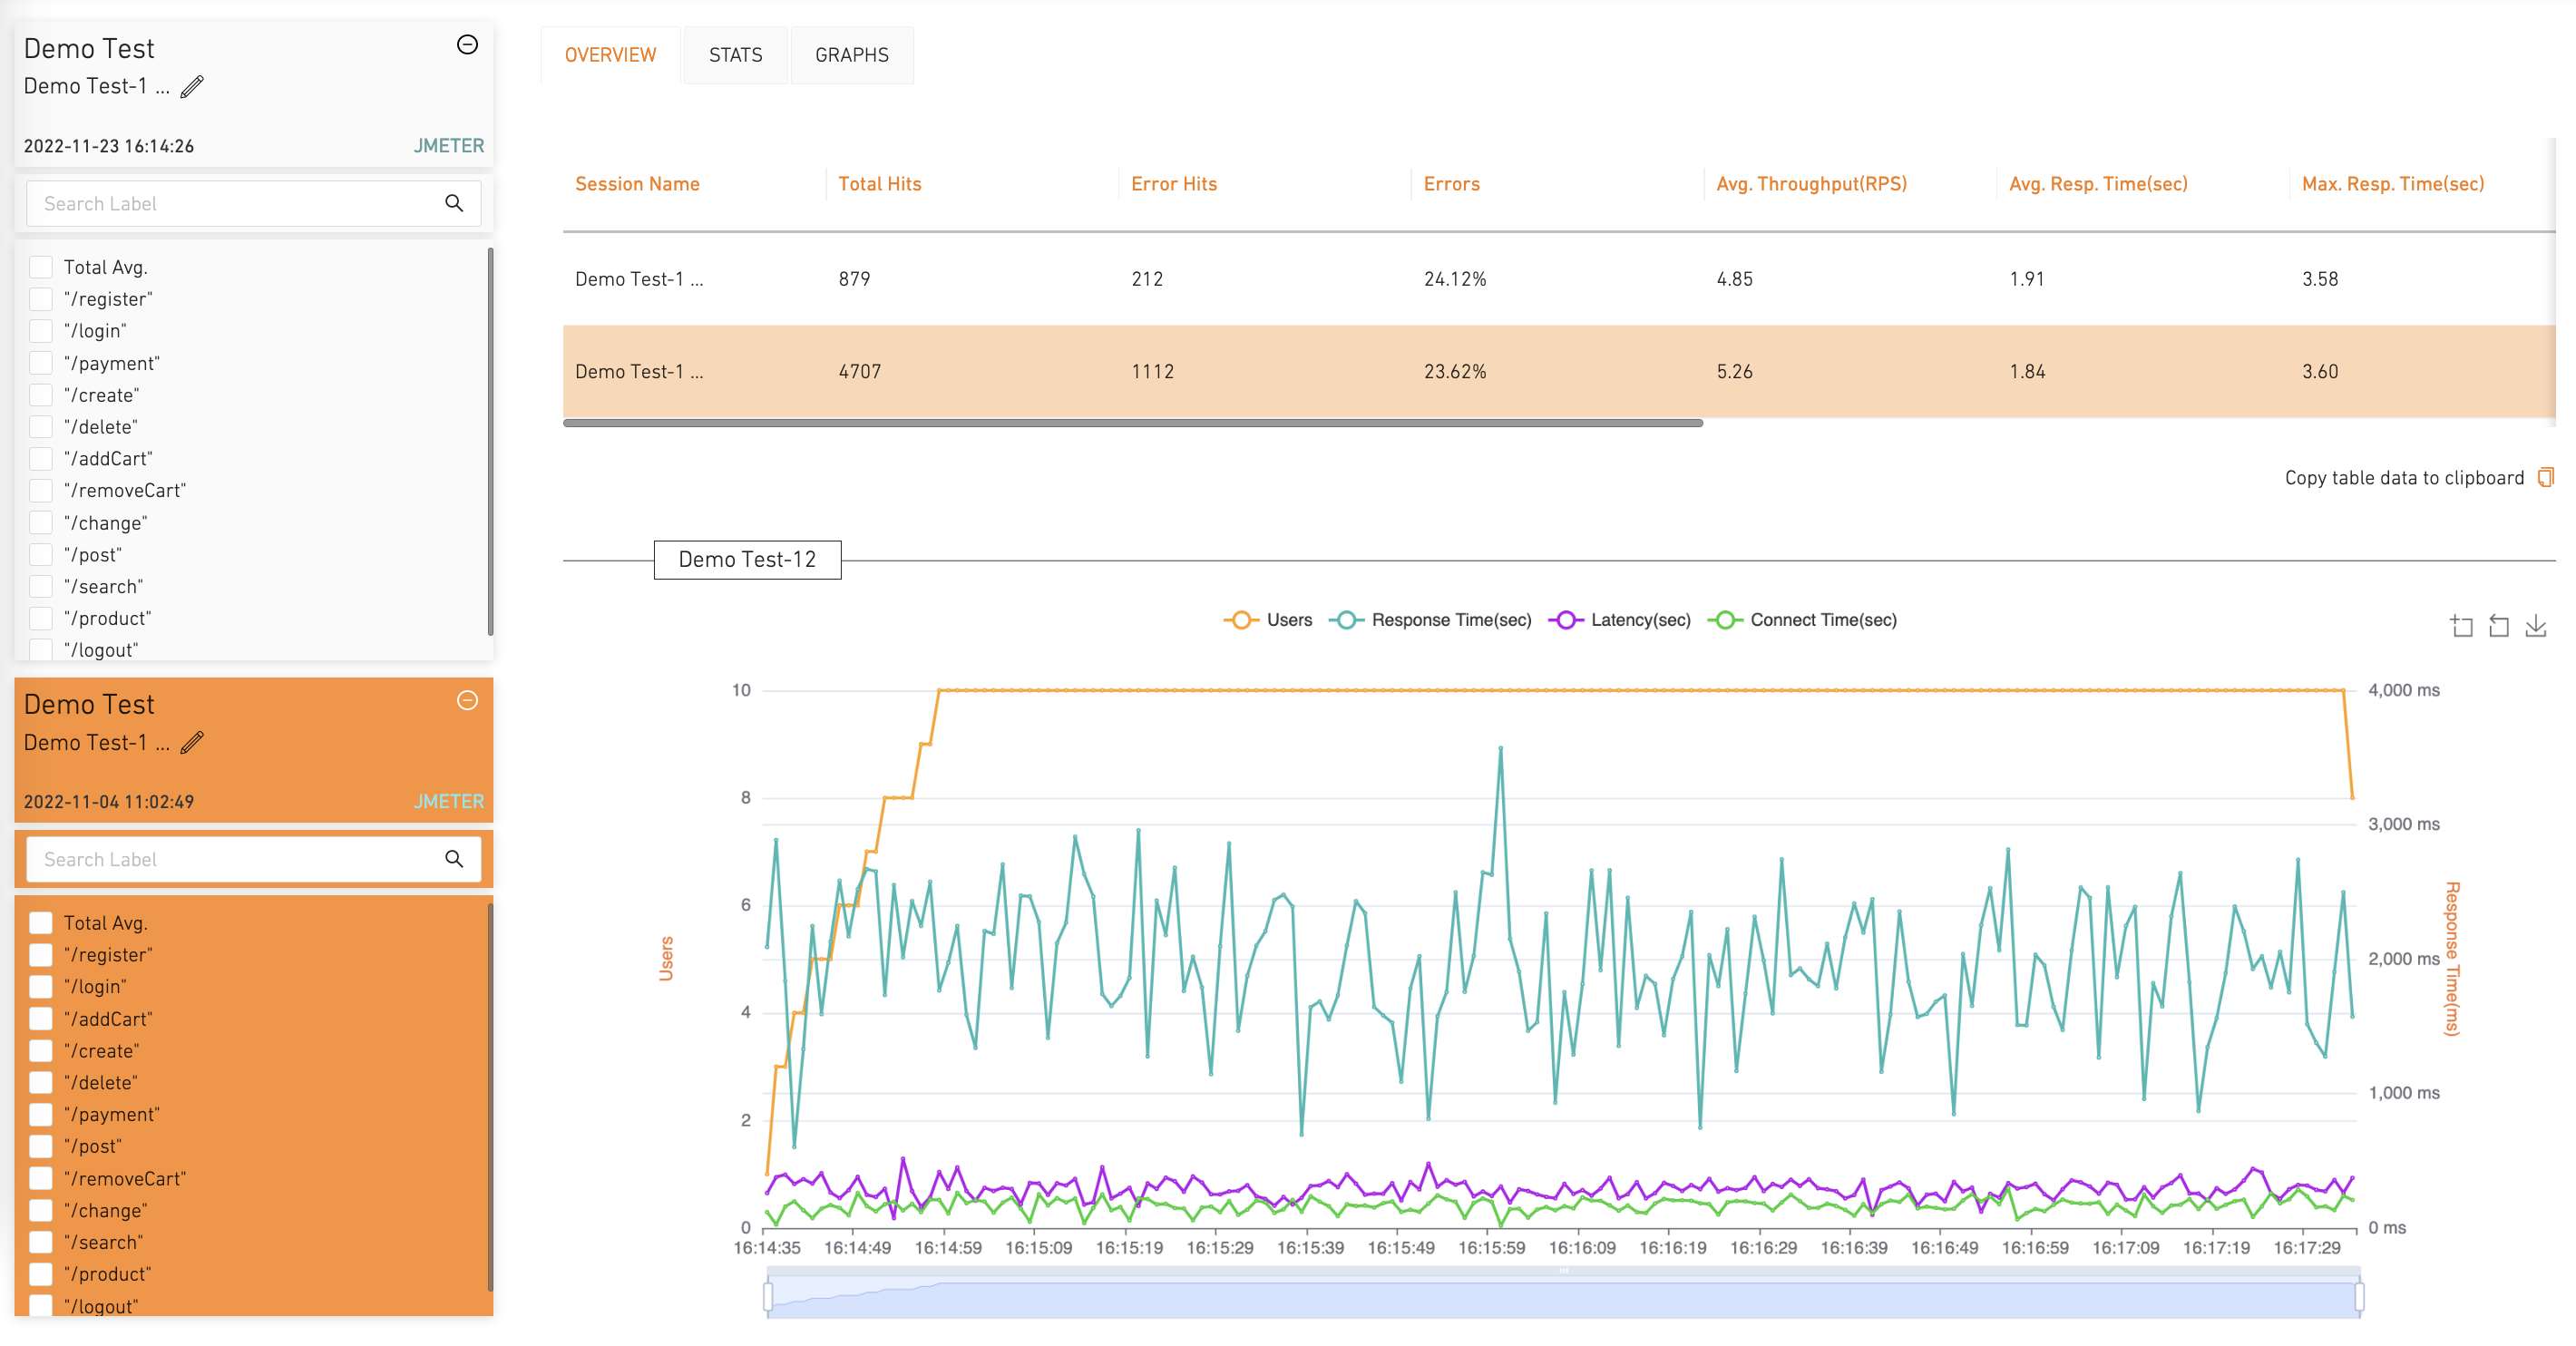
**5. Compare Test:** This option allows you to compare the results of test runs with each other.&#x20;

On the upper right, there is a navigation menu.

You can use the <mark style="color:green;">UPGRADE</mark> button to upgrade your subscription to a premium plan.

{% content-ref url="/pages/-MUSAoEB7WKUP6OKgxHU" %}
[Quick Start](/creating-your-first-test)
{% endcontent-ref %}

{% content-ref url="/pages/-MUT5hLDUtoTsSYDaFkV" %}
[Pricing OLD](/about-loadium/pricingold)
{% endcontent-ref %}

If you don't see the answer to your question here, please [reach out to us](https://loadium.com/contact-us/) to let us know! We're always improving our documentation.

Happy Testing!


# Quick Start

A quick introduction for Test Creation - Running - Analyzing

Loadium is designed to have a straightforward process to manage your load tests.

<figure><img src="/files/BUQ5Q4L38JtgIWazchCp" alt=""><figcaption></figcaption></figure>

When you first log in to Loadium, you will be presented with Home Page. There are five tabs in the banner menu:

{% tabs %}
{% tab title="Home Page" %}
Displays the list of the created tests, information for previous test runs, and package usage.

<figure><img src="/files/tsOPCE1YkFvxZphv3Xeq" alt=""><figcaption></figcaption></figure>
{% endtab %}

{% tab title="Projects" %}
Allows grouping of the created tests and displays them.

<figure><img src="/files/1KmektnOh3jV5vB6DUHK" alt=""><figcaption></figcaption></figure>
{% endtab %}

{% tab title="Create" %}
Allows you to start creating a test with Script Builder, JMeter file, Gatling file, and Selenium WebDriver editor. Also presents other options Convert to JMX and JTL to Loadium Report.

<figure><img src="/files/8osdRT0OHIpdUH8xove7" alt=""><figcaption></figcaption></figure>
{% endtab %}

{% tab title="Running" %}
Displays your actively running tests.

<figure><img src="/files/187fdBs1kWRf8wbLruBn" alt=""><figcaption></figcaption></figure>
{% endtab %}

{% tab title="Compare" %}
Allows you to compare the results of test runs with each other.

<figure><img src="/files/VDAJZFqeiZXjjB6wTauo" alt=""><figcaption></figcaption></figure>
{% endtab %}
{% endtabs %}

## 1) Test Creation

To start creating a test, you can either choose to create a new one through the online no-code web editor or upload your previously created script from the desired technology.

### Script Builder

You can create your own script from scratch through Loadium's online editor.

{% tabs %}
{% tab title="Simple HTTP Builder" %}

#### Simple HTTP Builder

A simplistic approach for creating your script where you will enter basic parameters like request type (GET, POST, PUT, DELETE), request URL, reponse\&connection timeout, etc.

<figure><img src="/files/BHxaPCVieyTe76pOXkqc" alt=""><figcaption></figcaption></figure>

Get started quickly with the Simple HTTP Builder guide:

{% content-ref url="/pages/-MUSBrNVrAlMwDQwoAG6" %}
[Simple HTTP Builder](/create-test/script-builder-old/http-test)
{% endcontent-ref %}
{% endtab %}

{% tab title="Record\&Play" %}

#### Record & Play

A more advanced approach where you can also record your web surfing with the Google Chrome extension to be used in the editor.

<figure><img src="/files/B4QmhQ8jyne7PCiJ3w34" alt=""><figcaption></figcaption></figure>

&#x20;                                       <img src="/files/9mSt8HPTNRoKS0qE57NZ" alt="" data-size="original">

Get started quickly with the Record\&Play guide:

{% content-ref url="/pages/-MZDGn7b1fvU2nxsA08m" %}
[Script Builder](/create-test/loadium-record-and-play)
{% endcontent-ref %}
{% endtab %}
{% endtabs %}

### By Uploading Script

Loadium supports open-source technologies to create & run your tests:

{% tabs %}
{% tab title="JMeter" %}

#### JMeter Test

Apache JMeter is an open-source tool that supports many protocols like HTTP, JDBC, LDAP, FTP, etc. Creating a JMeter test is the main feature of Loadium which supports all the key features of JMeter.

Get started quickly with the JMeter Test guide:

{% content-ref url="/pages/-MUSAunBwe2J09CIl1hu" %}
[JMeter Test](/create-test/jmeter-test)
{% endcontent-ref %}
{% endtab %}

{% tab title="Gatling" %}

#### **Gatling Test**&#x20;

Gatling is an open-source performance testing framework based on Scala, Akka and Netty. You can simply upload your Gatling file and desired CSV files to create your test and start testing.&#x20;

Get started quickly with the Gatling Test guide:

{% content-ref url="/pages/-MUSBc3iHQSjgBJ9Ppxx" %}
[Gatling Test](/create-test/gatling-test)
{% endcontent-ref %}
{% endtab %}

{% tab title="Web Driver" %}

#### Web Driver Test

Selenium WebDriver is a functional test automation library, you can use your Selenium scripts to create performance tests. You can also use Java and Javascript language to create Selenium-based performance tests.

Get started quickly with the Web Driver Test guide:

{% content-ref url="/pages/-MUSBuRvSupUi9j9Pb3I" %}
[WebDriver Test](/create-test/web-driver-test)
{% endcontent-ref %}
{% endtab %}
{% endtabs %}

## 2) Running

During test creation, you can manage the test settings to shape the test running course.

{% tabs %}
{% tab title="Load Configuration" %}
You can configure the virtual user amount, their ramp-up period, and test duration (some parameters may vary between the technologies)
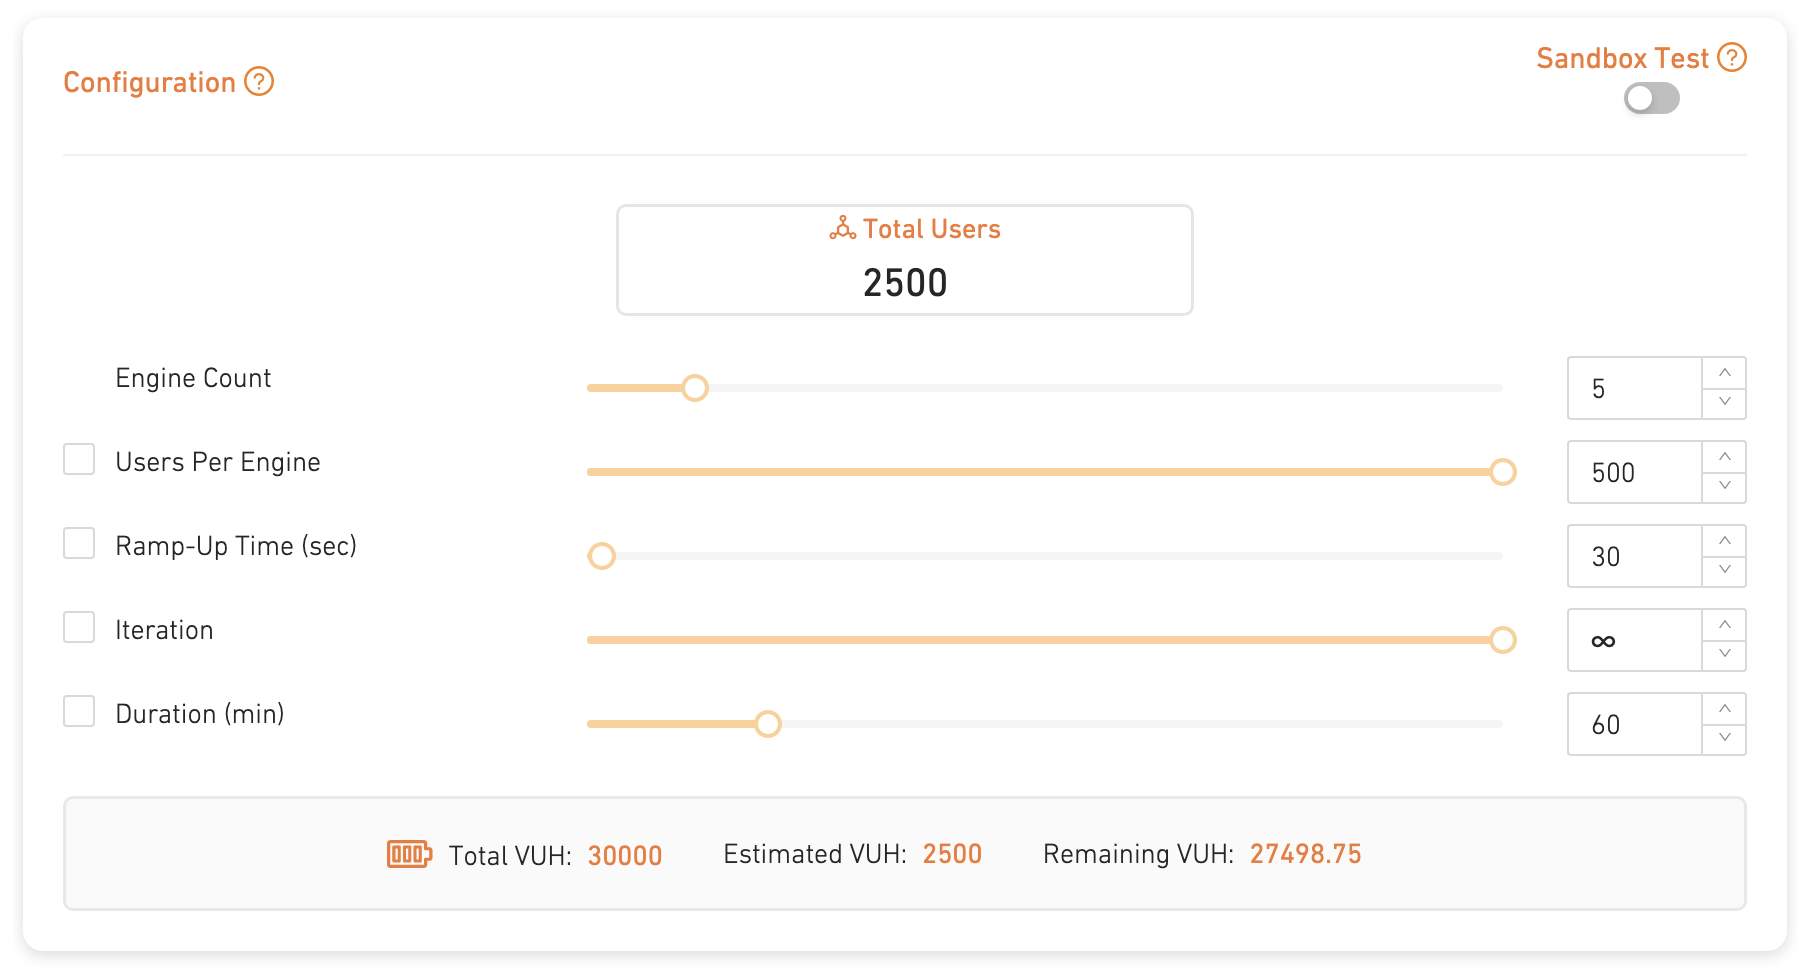
<figure><img src="/files/B1aTkI1rGNMvNVx3LlMD" alt=""><figcaption></figcaption></figure>
{% endtab %}

{% tab title="Geolocation" %}
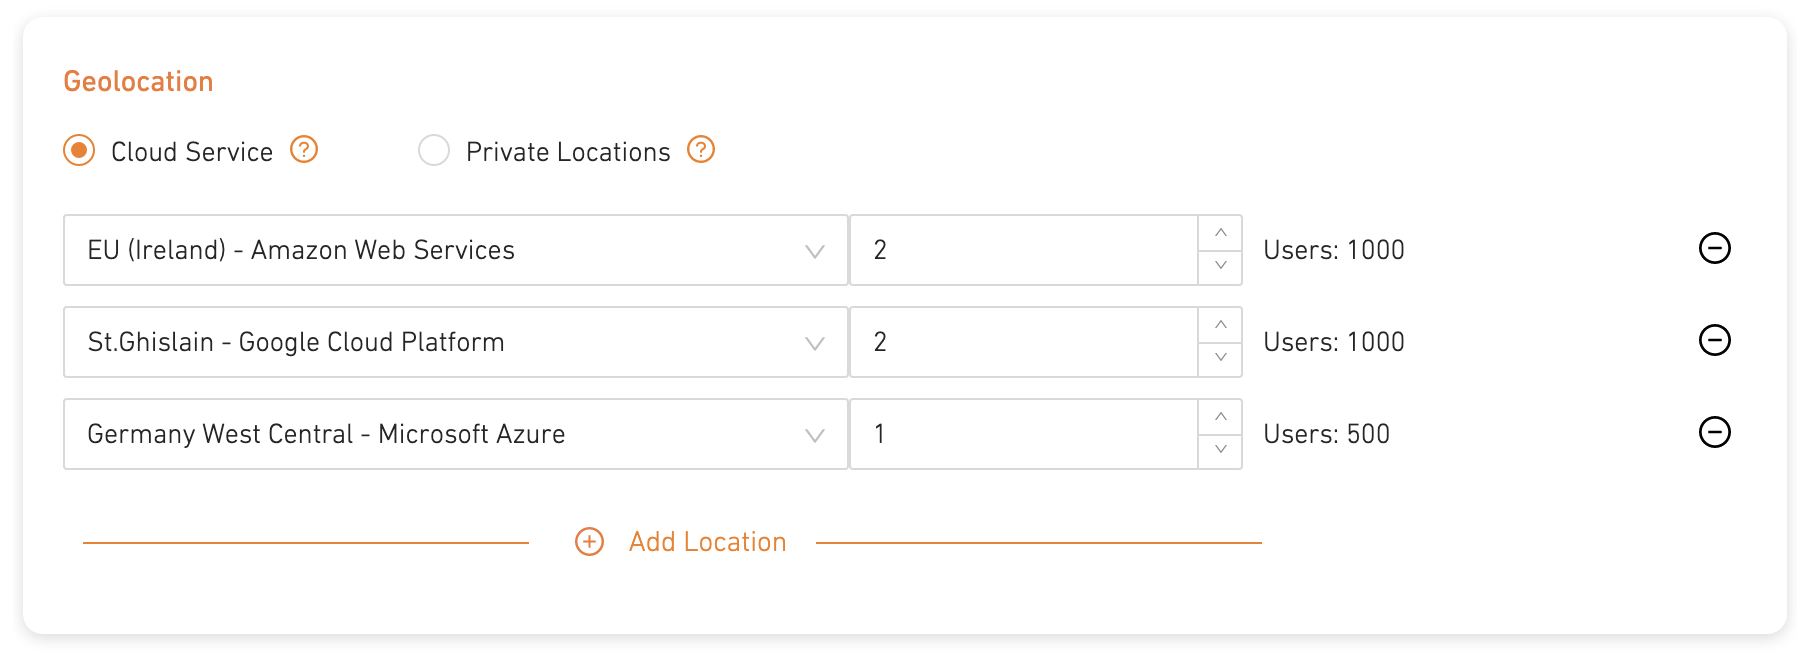
You can choose to distribute your load generation to multiple locations with Cloud Service or use your personal servers with Private Locations.

<figure><img src="/files/edfS5vUCVJjL3hGce39N" alt=""><figcaption></figcaption></figure>

You can see our guides for more detailed information.

{% content-ref url="/pages/-MUSE7GXKewmLpQmOWWW" %}
[Geolocation old ui](/test-settings/what-is-geolocation)
{% endcontent-ref %}

{% content-ref url="/pages/-MYABRi8YJLiiG9YuvpQ" %}
[Private Location old ui](/features/private-location)
{% endcontent-ref %}
{% endtab %}

{% tab title="Failure Criteria" %}
An <mark style="color:purple;">optional</mark> feature where you can choose certain KPI metrics and set thresholds for each request to track their performance

<figure><img src="/files/81jIFsdp4AIeSPbTdfBd" alt=""><figcaption></figcaption></figure>

You can see our guide for more detailed information.

{% content-ref url="/pages/CDD5Gw1xs3k317iv9ZFt" %}
[Failure Criteria old](/test-settings/failure-criteria-old)
{% endcontent-ref %}
{% endtab %}

{% tab title="Scheduling" %}
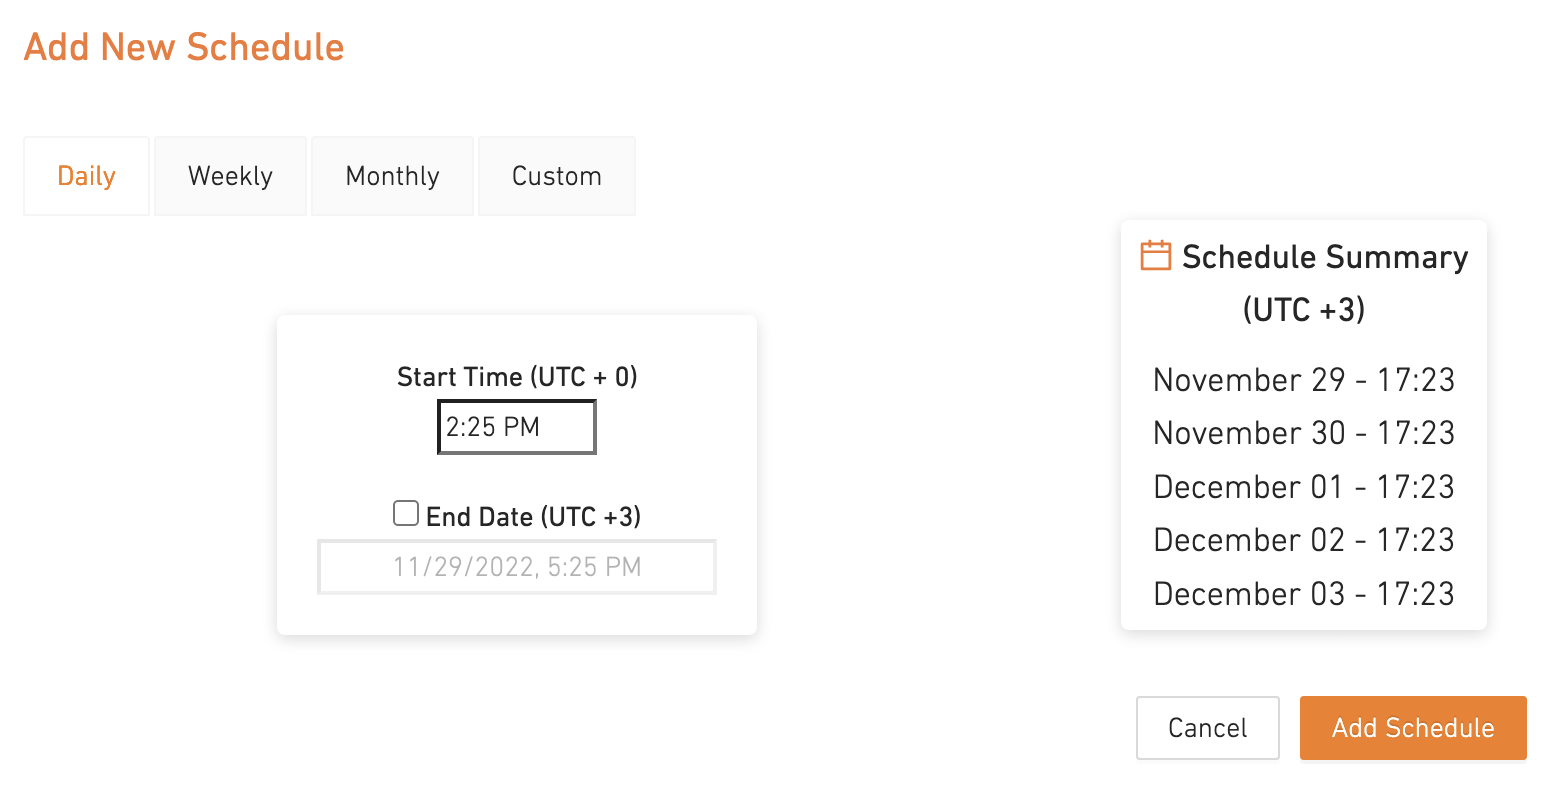
An <mark style="color:purple;">optional</mark> feature where you can schedule your tests to automate their run.

<figure><img src="/files/qUhWtyIdJukb2jrnmgWI" alt=""><figcaption></figcaption></figure>
{% endtab %}

{% tab title="APM" %}
An <mark style="color:purple;">optional</mark> feature where you can integrate New Relic or AppDynamics APM Tools to get their metrics displayed on the Loadium Report.

<figure><img src="/files/B2VLnZIkMMDk9usoVUnR" alt=""><figcaption></figcaption></figure>

You can see our guide for more detailed information.

{% content-ref url="/pages/-MUheY65faqUboU8iwG4" %}
[Broken mention](broken://pages/-MUheY65faqUboU8iwG4)
{% endcontent-ref %}
{% endtab %}
{% endtabs %}

When you finish creating a test, the information you have put; uploaded files, load configurations, geolocations, KPI, etc. will be saved and you can access it from the Home Page. You can run your created tests from the Home Page.

<figure><img src="/files/WLB7z5tHU7bTzBZ9ANWm" alt=""><figcaption></figcaption></figure>

## 3) Analyzing

{% tabs %}
{% tab title="Test Report" %}
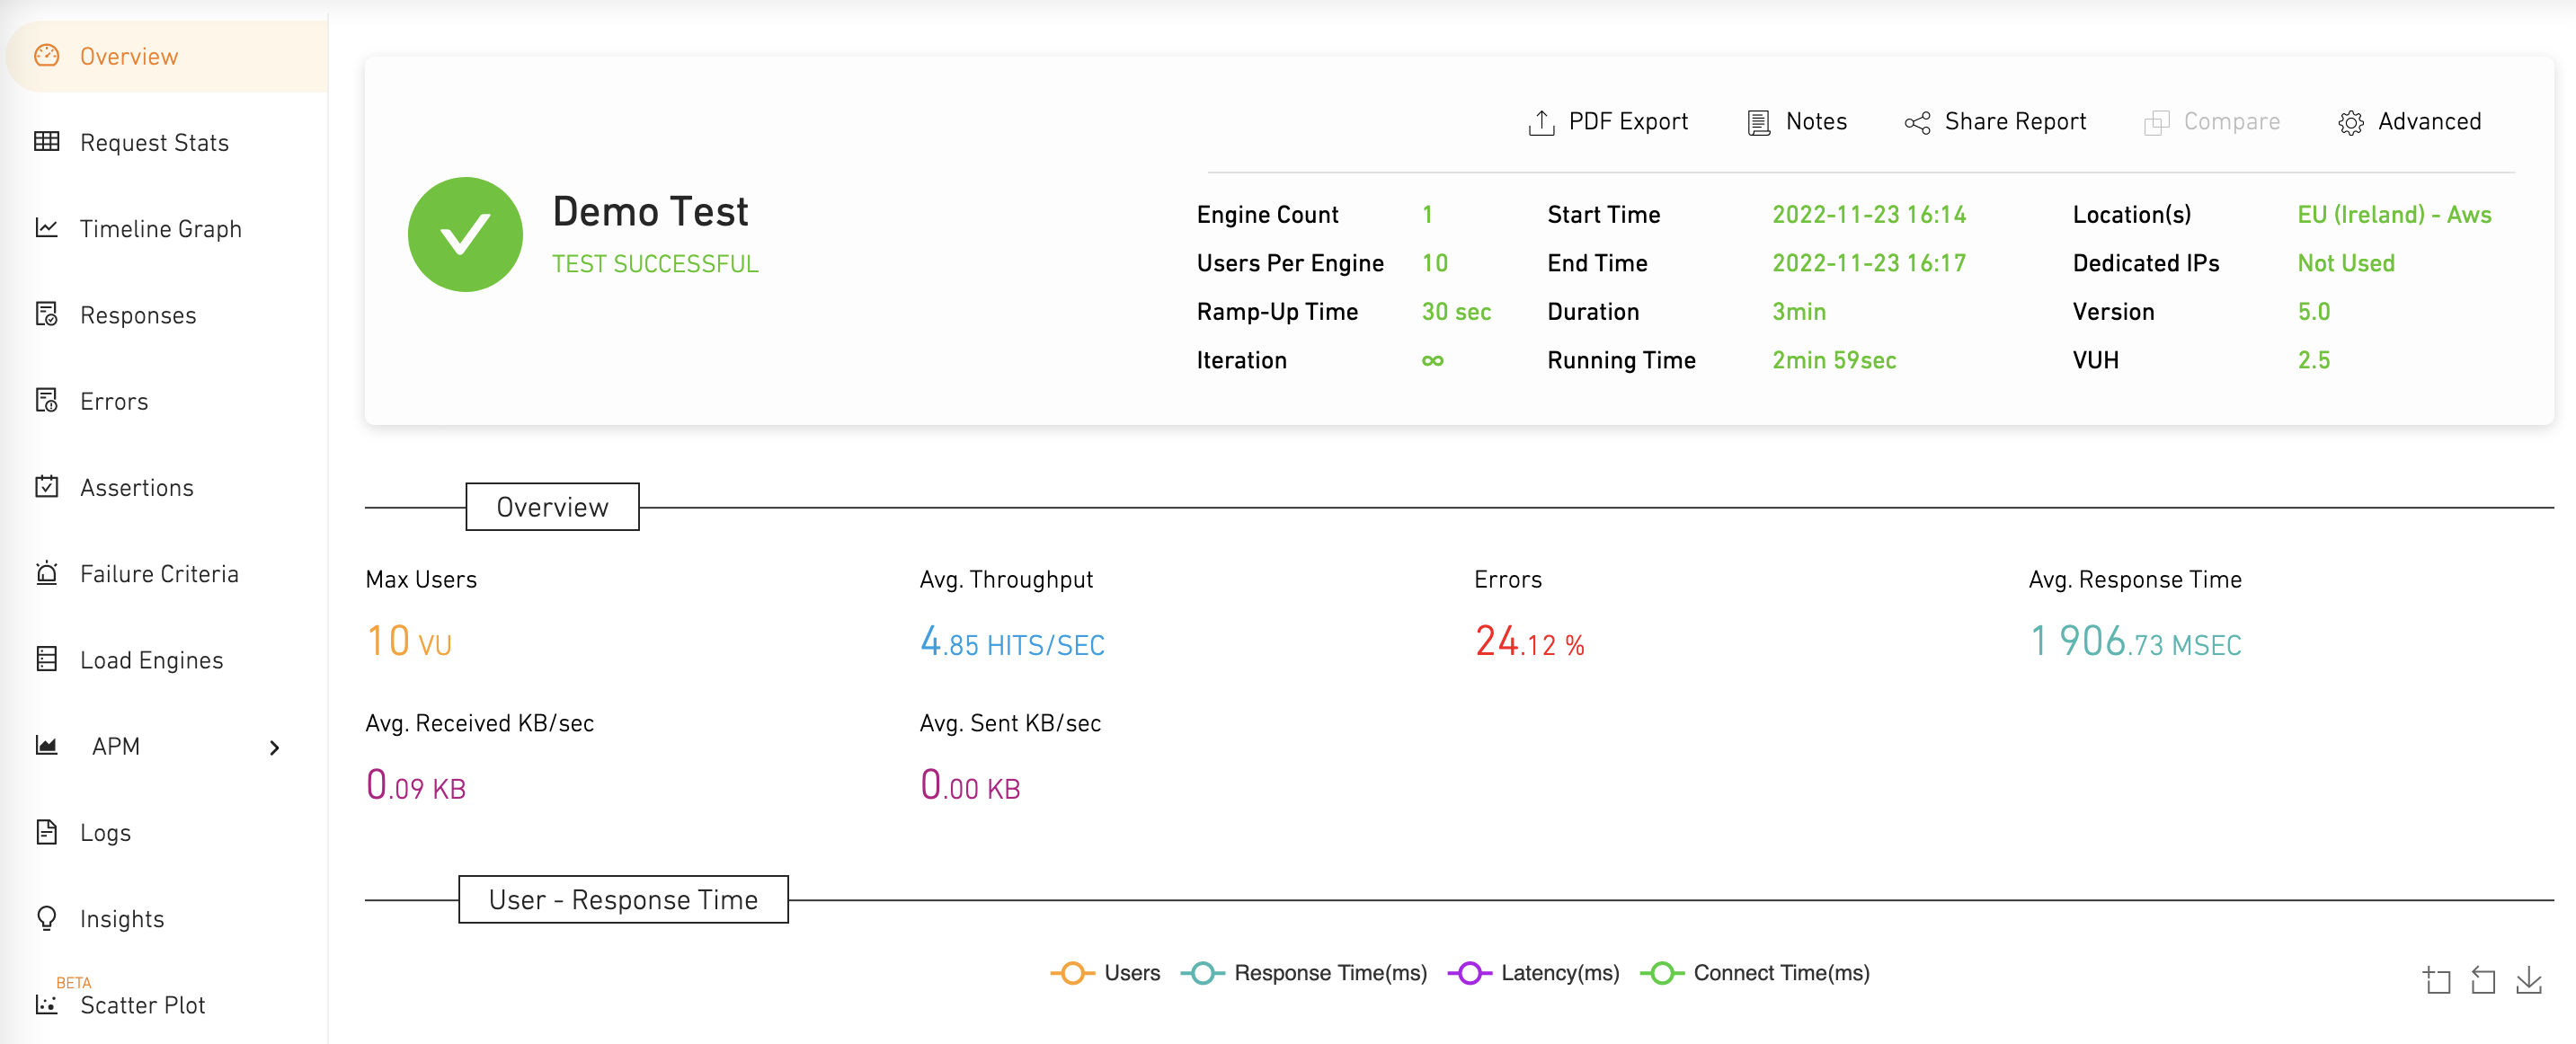
During a test run, the test metrics will be presented lively. After a test finishes, you can access these reports from the test's Sessions page.

<figure><img src="/files/3wmy5Qwn1A06c6Co05Q7" alt=""><figcaption></figcaption></figure>

You can check out the Test Report guide for a more comprehensive cover:

{% content-ref url="/pages/tL8rqie6IhBi2pRqvD3G" %}
[Test Report](/features/test-report)
{% endcontent-ref %}
{% endtab %}

{% tab title="Compare Test" %}
Loadium allows you to compare your tests to help you to analyze your tests better. A quick guide for it will be coming soon!
{% endtab %}

{% tab title="Observing Progress" %}
After several runs of your same created test, the overall progress of test results will be presented in the test's Sessions Page.

<figure><img src="/files/yeRJwau7Yigkx4qC0oOf" alt=""><figcaption></figcaption></figure>
{% endtab %}
{% endtabs %}

If you don't see the answer to your question here, please [reach out to us](https://loadium.com/contact-us/) to let us know! We're always improving our documentation.

Enjoy testing!


# Common Reasons For Execution Fails

Loadium test executions can occasionally be interrupted due to user-side misconfigurations, missing data, or network access issues. This guide addresses the most common problems and their solutions.

<figure><img src="/files/7JHyAZl9Cp26HYG6YkWh" alt=""><figcaption></figcaption></figure>

## 1. CSV Dataset Config Configurations

* Typo in csv dataset config.

<figure><img src="/files/24t3qlVUY7PuyVwccyXm" alt=""><figcaption><p>Example: JMeter CSV Element</p></figcaption></figure>

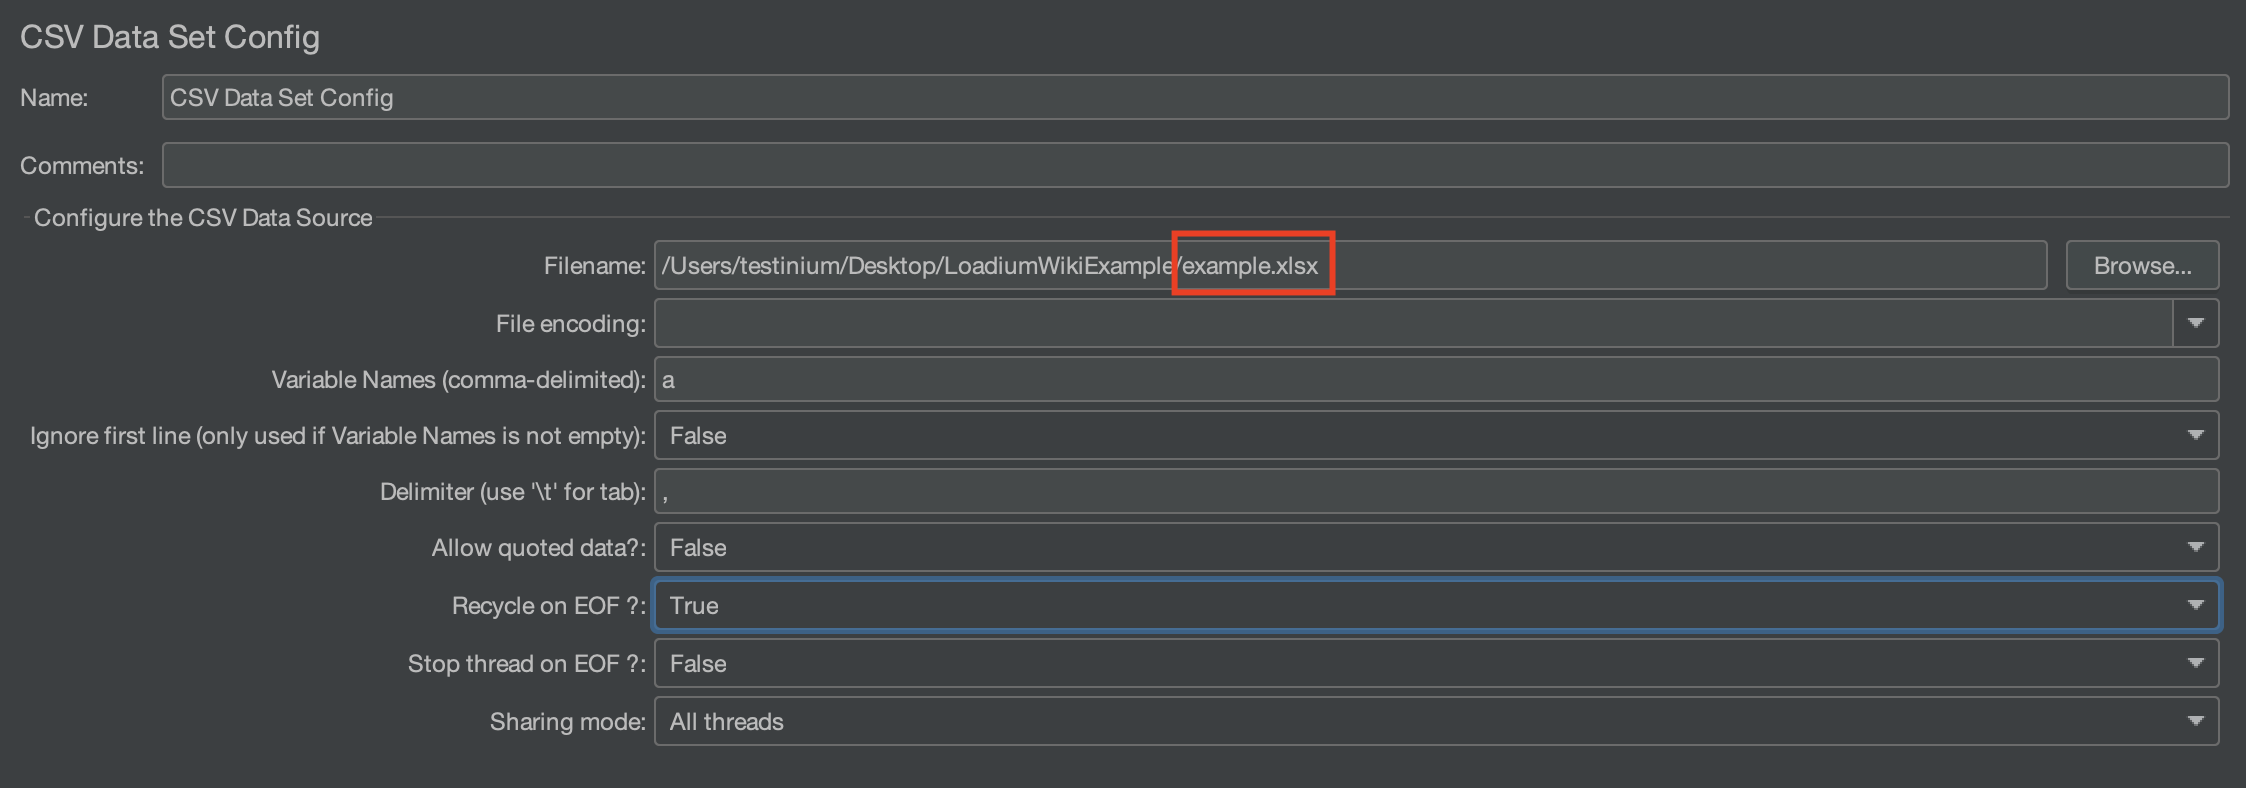
* Giving an invalid file extension in csv dataset config.

<figure><img src="/files/lfbUqFPxGuZSIiE585Nn" alt=""><figcaption><p>Example: JMeter CSV Element</p></figcaption></figure>

## 2. Incorret CSV Format

An incorrect CSV format can cause JMeter tests to fail unexpectedly. Issues such as the wrong number of columns, incorrect headers, or mismatched data types often lead to errors during test execution. To ensure proper functionality, the CSV file must be correctly formatted and aligned with the test plan's requirements, providing the necessary data accurately.

## 3. Public Access Restriction

Loadium initializes virtual machines for load tests from cloud providers such as AWS, Azure, and GCP. If the target environment is restricted from public access, the virtual machines may not be able to connect, preventing the test from starting.

## 4. Plugin Versions

The versions of the plugins used in the test scripts are not up to date, the tests may start properly.&#x20;

<figure><img src="/files/MCiyJ6CyuuuCSe2Qdqyz" alt=""><figcaption><p>Example: JMeter Plugin Manager</p></figcaption></figure>

## 5. Invalid JMX

An invalid JMX file in JMeter tests can cause tests to fail before they start.

Common issues include:

* Syntax errors
* Corrupted elements
* Unsupported font types (such as non-Latin characters)
* Missing configurations within the JMX file.

These errors prevent Loadium from properly executing the test file, leading to failures. It's essential to validate and correct the JMX file to ensure smooth and successful test execution.

## 6. Very Long Response Times

In cases where the first HTTP response (from any request) during a performance test takes more than 120 seconds to return to Loadium, it may be labeled as 'failed' by the system. Ensure that your virtual user load configuration (e.g., ramp-up time) is appropriate for the target environment, or consider using a monitoring tool to check your services.

Similarly, at any point during the test, if no data is received for 120 seconds, the system may label it as 'failed'.


# JMeter Test

A quick guide for creating JMeter test on Loadium

Apache JMeter is an open-source tool that supports many protocols like HTTP, JDBC, LDAP, FTP, etc. You can upload your previously created JMX script to Loadium to run tests. You can go to Create Page and choose JMeter Test to start creating a test.

## **1) Basics**

<figure><img src="/files/gvK062iczLxE4DzwXFzF" alt=""><figcaption></figcaption></figure>

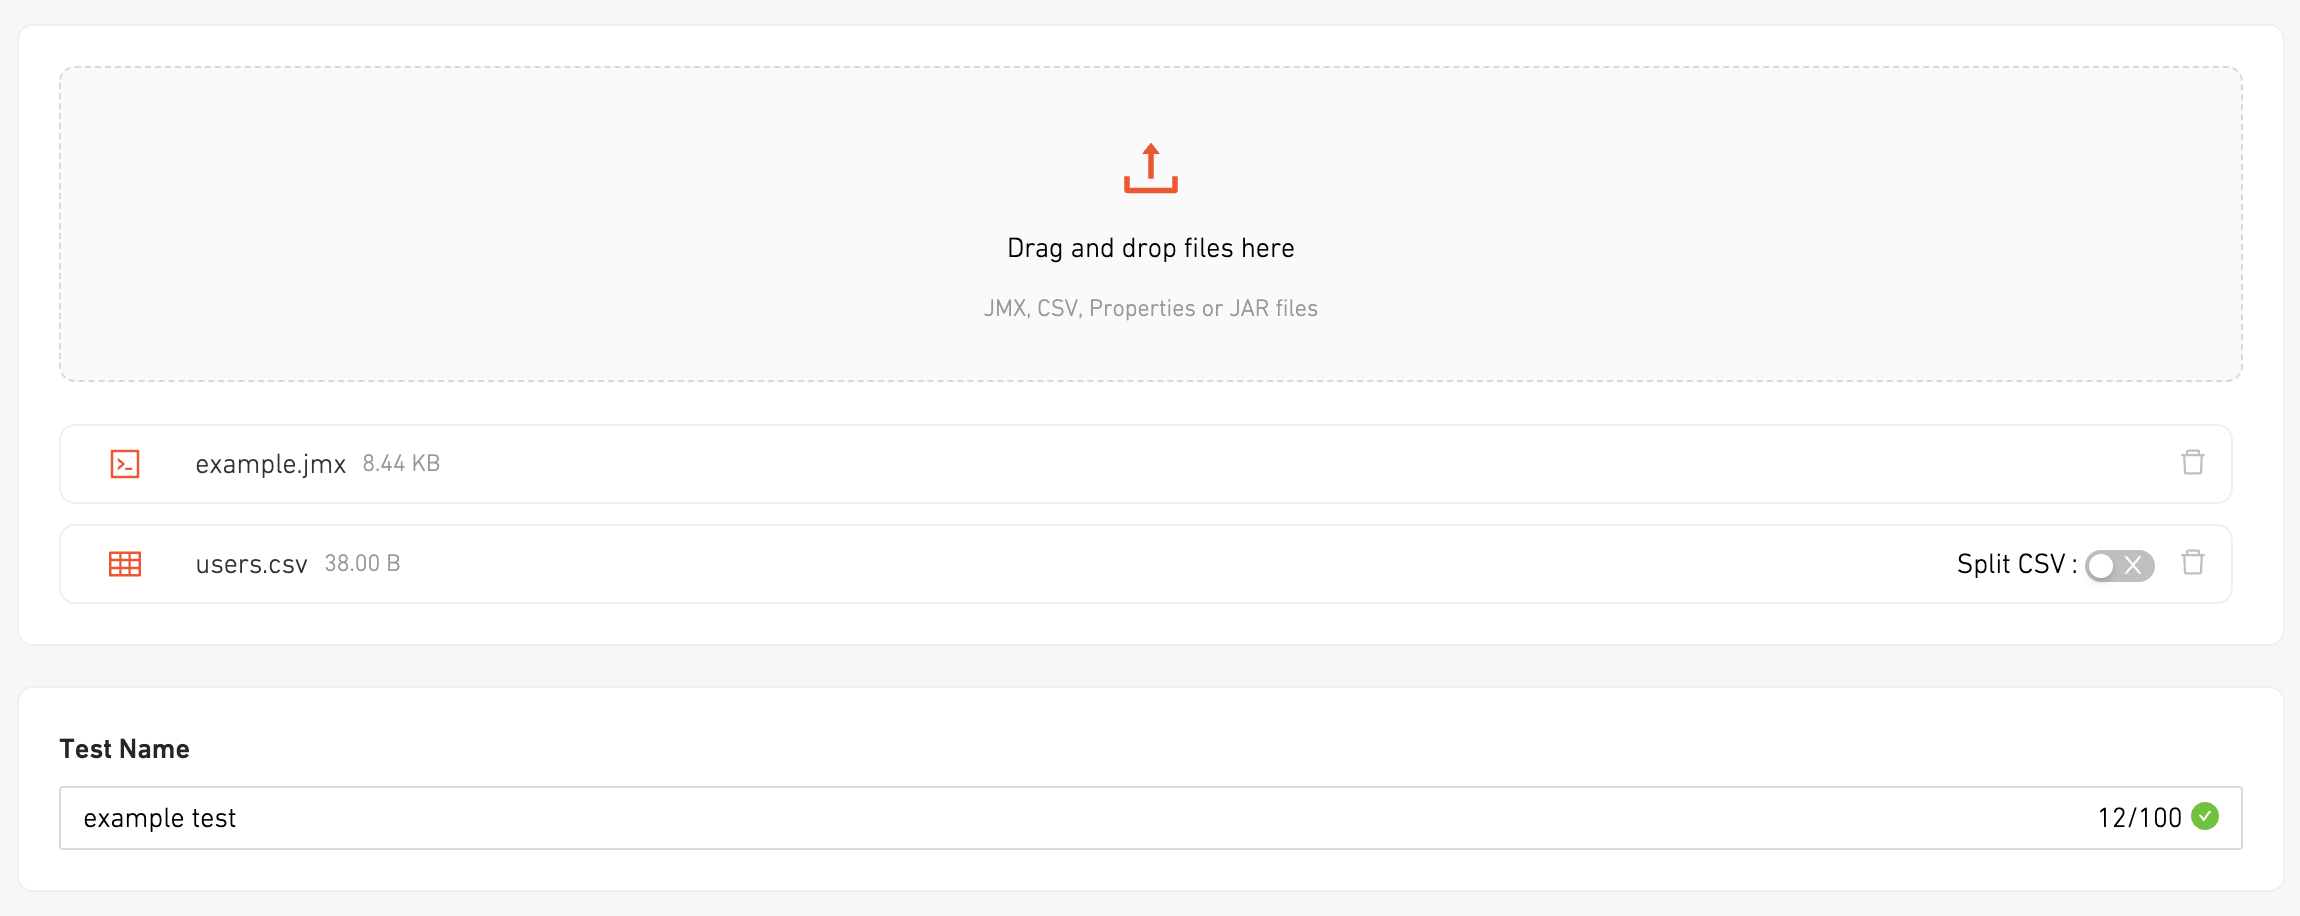
* **File Upload** area let you upload JMeter scripts, CSV files or other third-party JARs. Whenever a test is saved, newly added files are uploaded to our servers. In case there’s an update, Loadium will automatically update the files by matching them by their file name
* **Test Name** is a mandatory field as it will be referenced in future usage (test reports, comparing tests, etc.)

{% hint style="info" %}
**Note:** At least a JMX file is mandatory to save a performance test project.
{% endhint %}

{% hint style="info" %}
**Note:** In case, your JMeter scripts are using a CSV file, this file’s location should be an absolute path.

🙌🏻  **Example:** In case JMX file has “/usr/loadium/perf\_test/user\_data.csv” as CSV file path, it should be changed to “user\_data.csv”. Uploaded files will be stored in the same directory in remote engines so there shouldn’t be a relative path.
{% endhint %}

* **Split CSV** is optional. Toggle your CSV files to split their data into engines uniquely. You can find more detailed information about this feature [here](https://wiki.loadium.com/test-settings/what-is-split-csv).

## **2) Configuration**

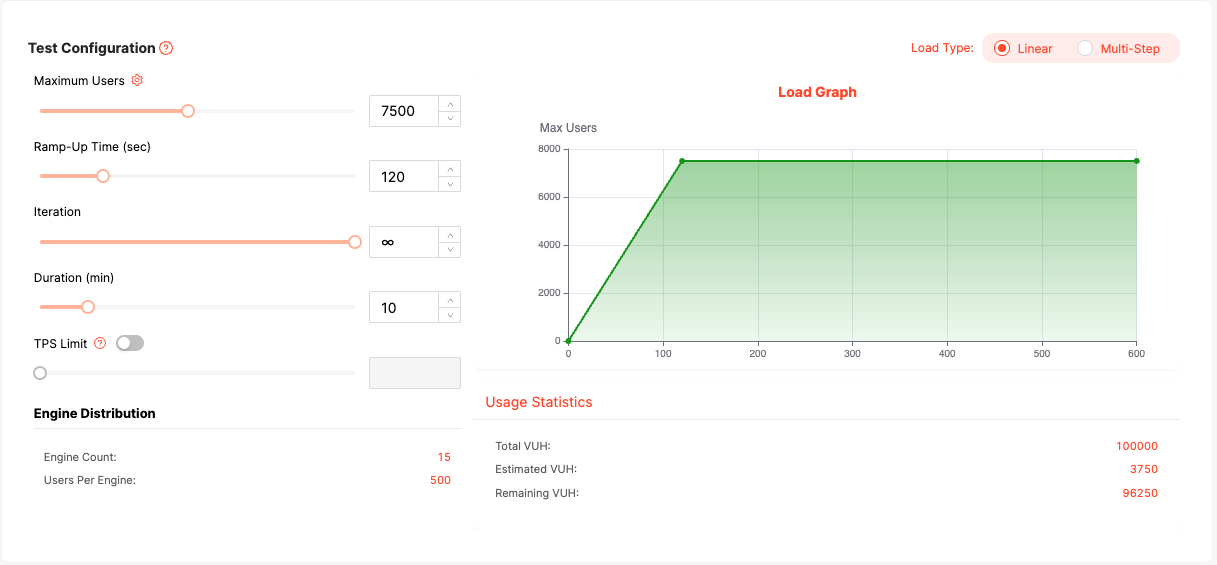
Configuration panel allows you to set the size and progression of your load test. Depending on the configuration set here, the behavior of the load will be determined. In case you want to override Loadium parameters, tick the checkbox next to each parameter to use the uploaded JMeter script’s configuration.

<figure><img src="/files/1lqkY87o0ZRJXYvwTkuZ" alt=""><figcaption></figcaption></figure>

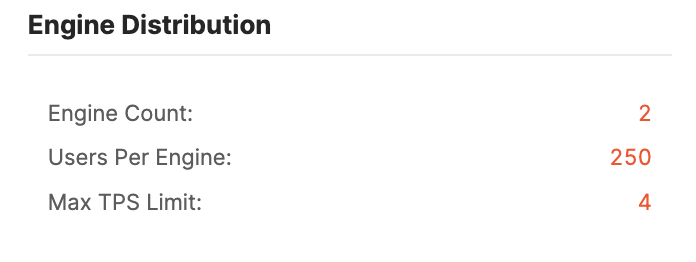
* **Maximum Users:** Total amount of virtual users that are going to execute the script. Calculated by Engine Count \* Users Per Engine
* **Ramp-Up Time:** The amount of time that should pass (in seconds) to reach the total users, starting from 0 threads. Threads increase linearly.

{% hint style="info" %}
🙌🏻  **Example:** In case you have 500 total users and 10 seconds ramp-up time, for every second, 50 threads will be generated by Loadium.
{% endhint %}

* **Iteration:** Number of the script executions will be iterated by virtual users.
* **Duration:** Test period (in minutes) for Loadium to execute.&#x20;
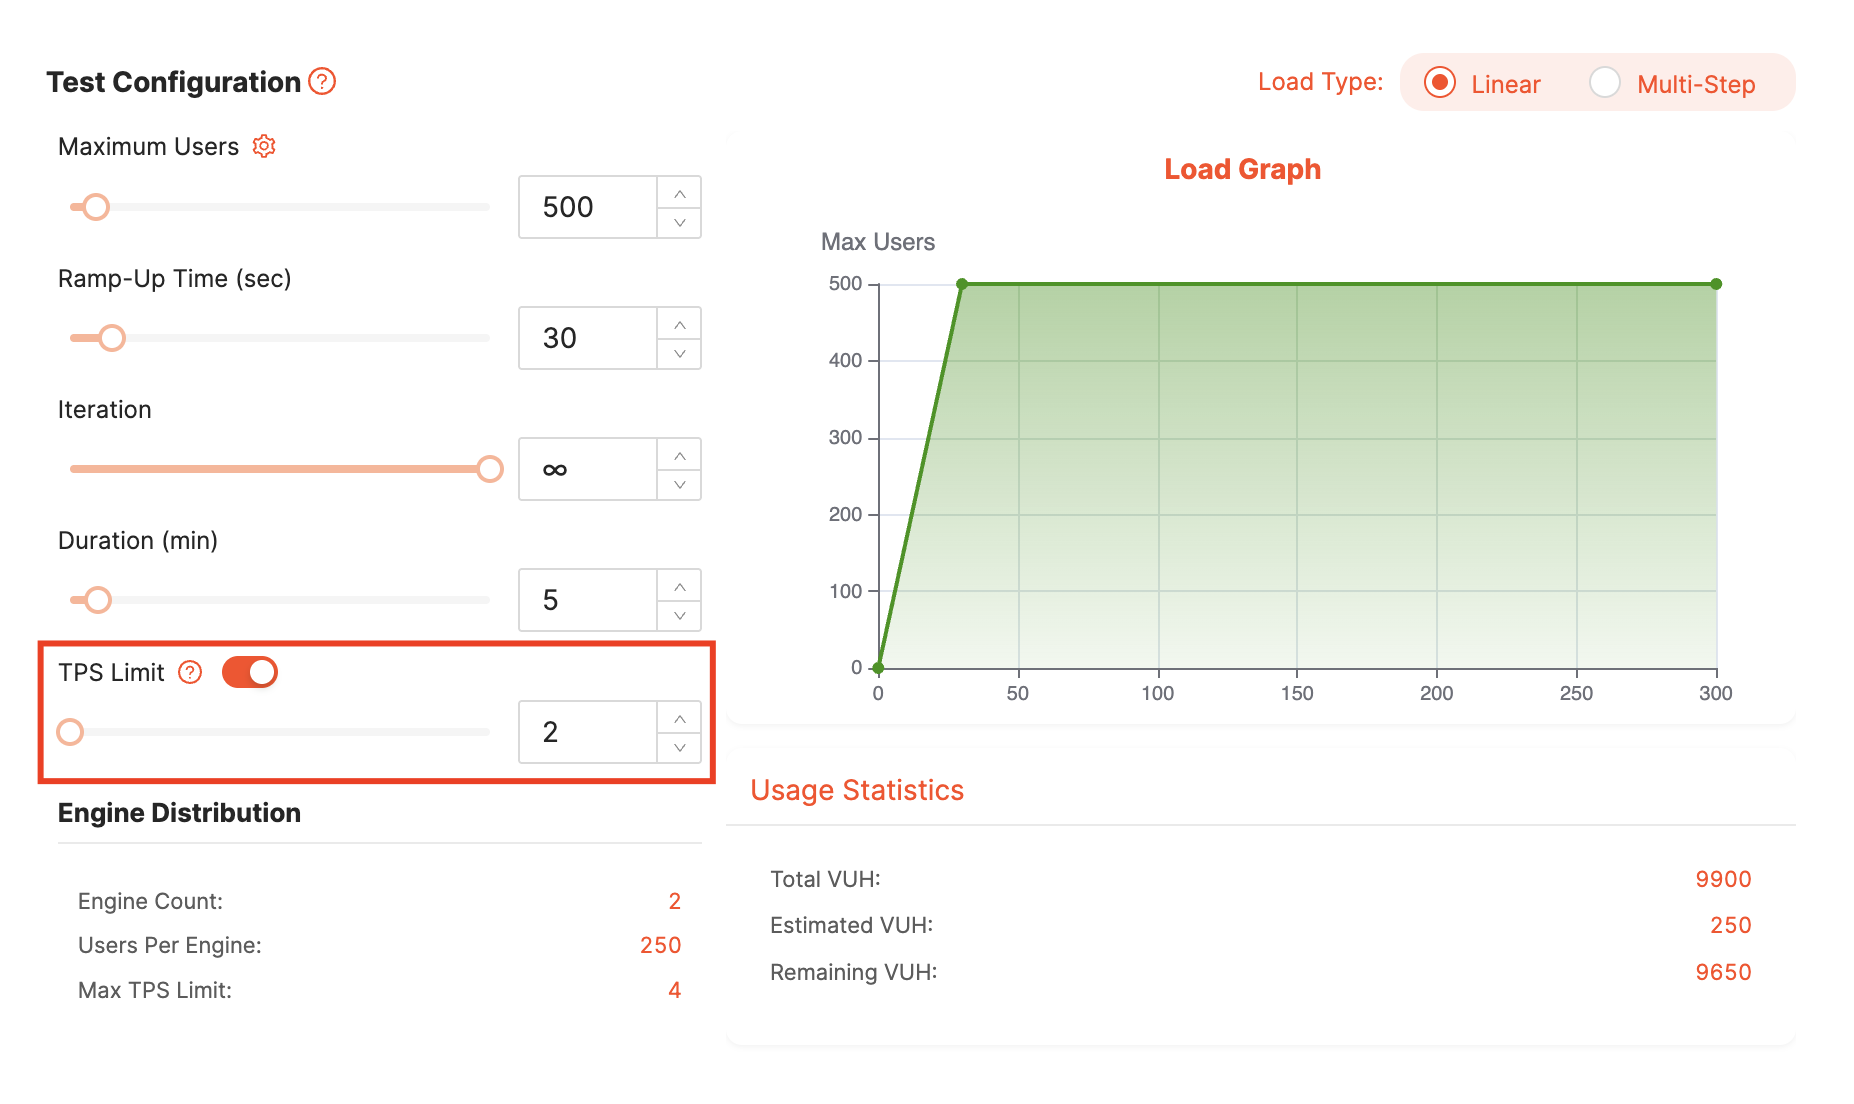
* **TPS Limit: A**llows you to limit the total throughput (requests happening per second) of the test’s execution. This limitation works on engines individually, so if you are using “X” amount of engines, the maximum throughput across all engines will be limited to X \* Limit Value. You can find more detailed information about TPS [here](/test-settings/what-is-tps).

You can find more detailed information on the TPS page.

{% content-ref url="/pages/-MUSE27VOvlt1xnKhF7z" %}
[TPS old ui](/test-settings/what-is-tps)
{% endcontent-ref %}

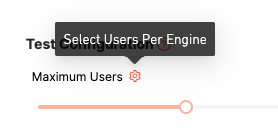
If you want to configure engine count and threads manually, click on the button indicated in the image.

<p align="center"><br><img src="/files/DSwtxXtoegxaN54sFpOT" alt=""></p>

<p align="center"></p>

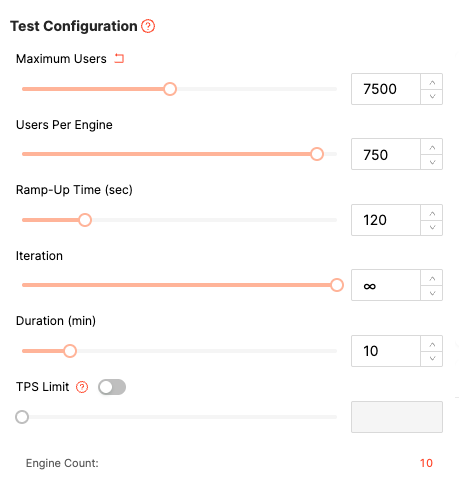
This button allows you to see and configure ***Users Per Engine*** selection.&#x20;

<p align="center"><br><img src="/files/dBzZeQ7seT0RCmgzzgfP" alt="" data-size="original"></p>

<p align="center"></p>

* **Users Per Engine:** Amount of users (threads) that will be generated from each engine to execute the script.

{% hint style="warning" %}
**Note:** The test will be concluded whichever is reached first; test duration or iteration.

The test can be concluded before the iteration count is reached, due to the duration being reached. The same rule applies to vice versa. If all iterations are completed before the defined duration, the test will be concluded.
{% endhint %}

## **3) Geolocation**

<figure><img src="/files/t4xtMLXJDX3Lju2as5W0" alt=""><figcaption></figcaption></figure>

#### Cloud Services

Loadium allows you to run globally distributed load tests by providing servers. Lets you select regions to execute situational user simulations. When a location is chosen, engines will be generated in that particular region and all requests will come from that region.

You can find more detailed information on the Geolocation page.

{% content-ref url="/pages/-MUSE7GXKewmLpQmOWWW" %}
[Geolocation old ui](/test-settings/what-is-geolocation)
{% endcontent-ref %}

#### Private Location

Instead of provided servers, Loadium allows you to create custom locations with [Docker](https://www.docker.com/) integration to run load tests from your personal servers.

You can find more detailed information on the Private Location page.

{% content-ref url="/pages/-MYABRi8YJLiiG9YuvpQ" %}
[Private Location old ui](/features/private-location)
{% endcontent-ref %}

**Dedicated IP:** If the system that is going to be tested has access limitations such as a firewall or DDoS protection, you can rent static IP’s and whitelist them to allow Loadium to perform a load test on the system. Enabling this option will run the test with the rented dedicated IP’s. To rent dedicated IP’s, please [contact our support](https://loadium.com/contact-us).

You can find more detailed information on the Dedicated IP page.

{% content-ref url="/pages/-MUSDlUqfBVdT1lh-1Bf" %}
[Dedicated IP old ui](/test-settings/what-is-dedicated-ip-old)
{% endcontent-ref %}

## 4) Other Settings

**Notes:** Allows you to enter additional details and self-explanatory notes. Your note will be appear in your test report when the test is finished.

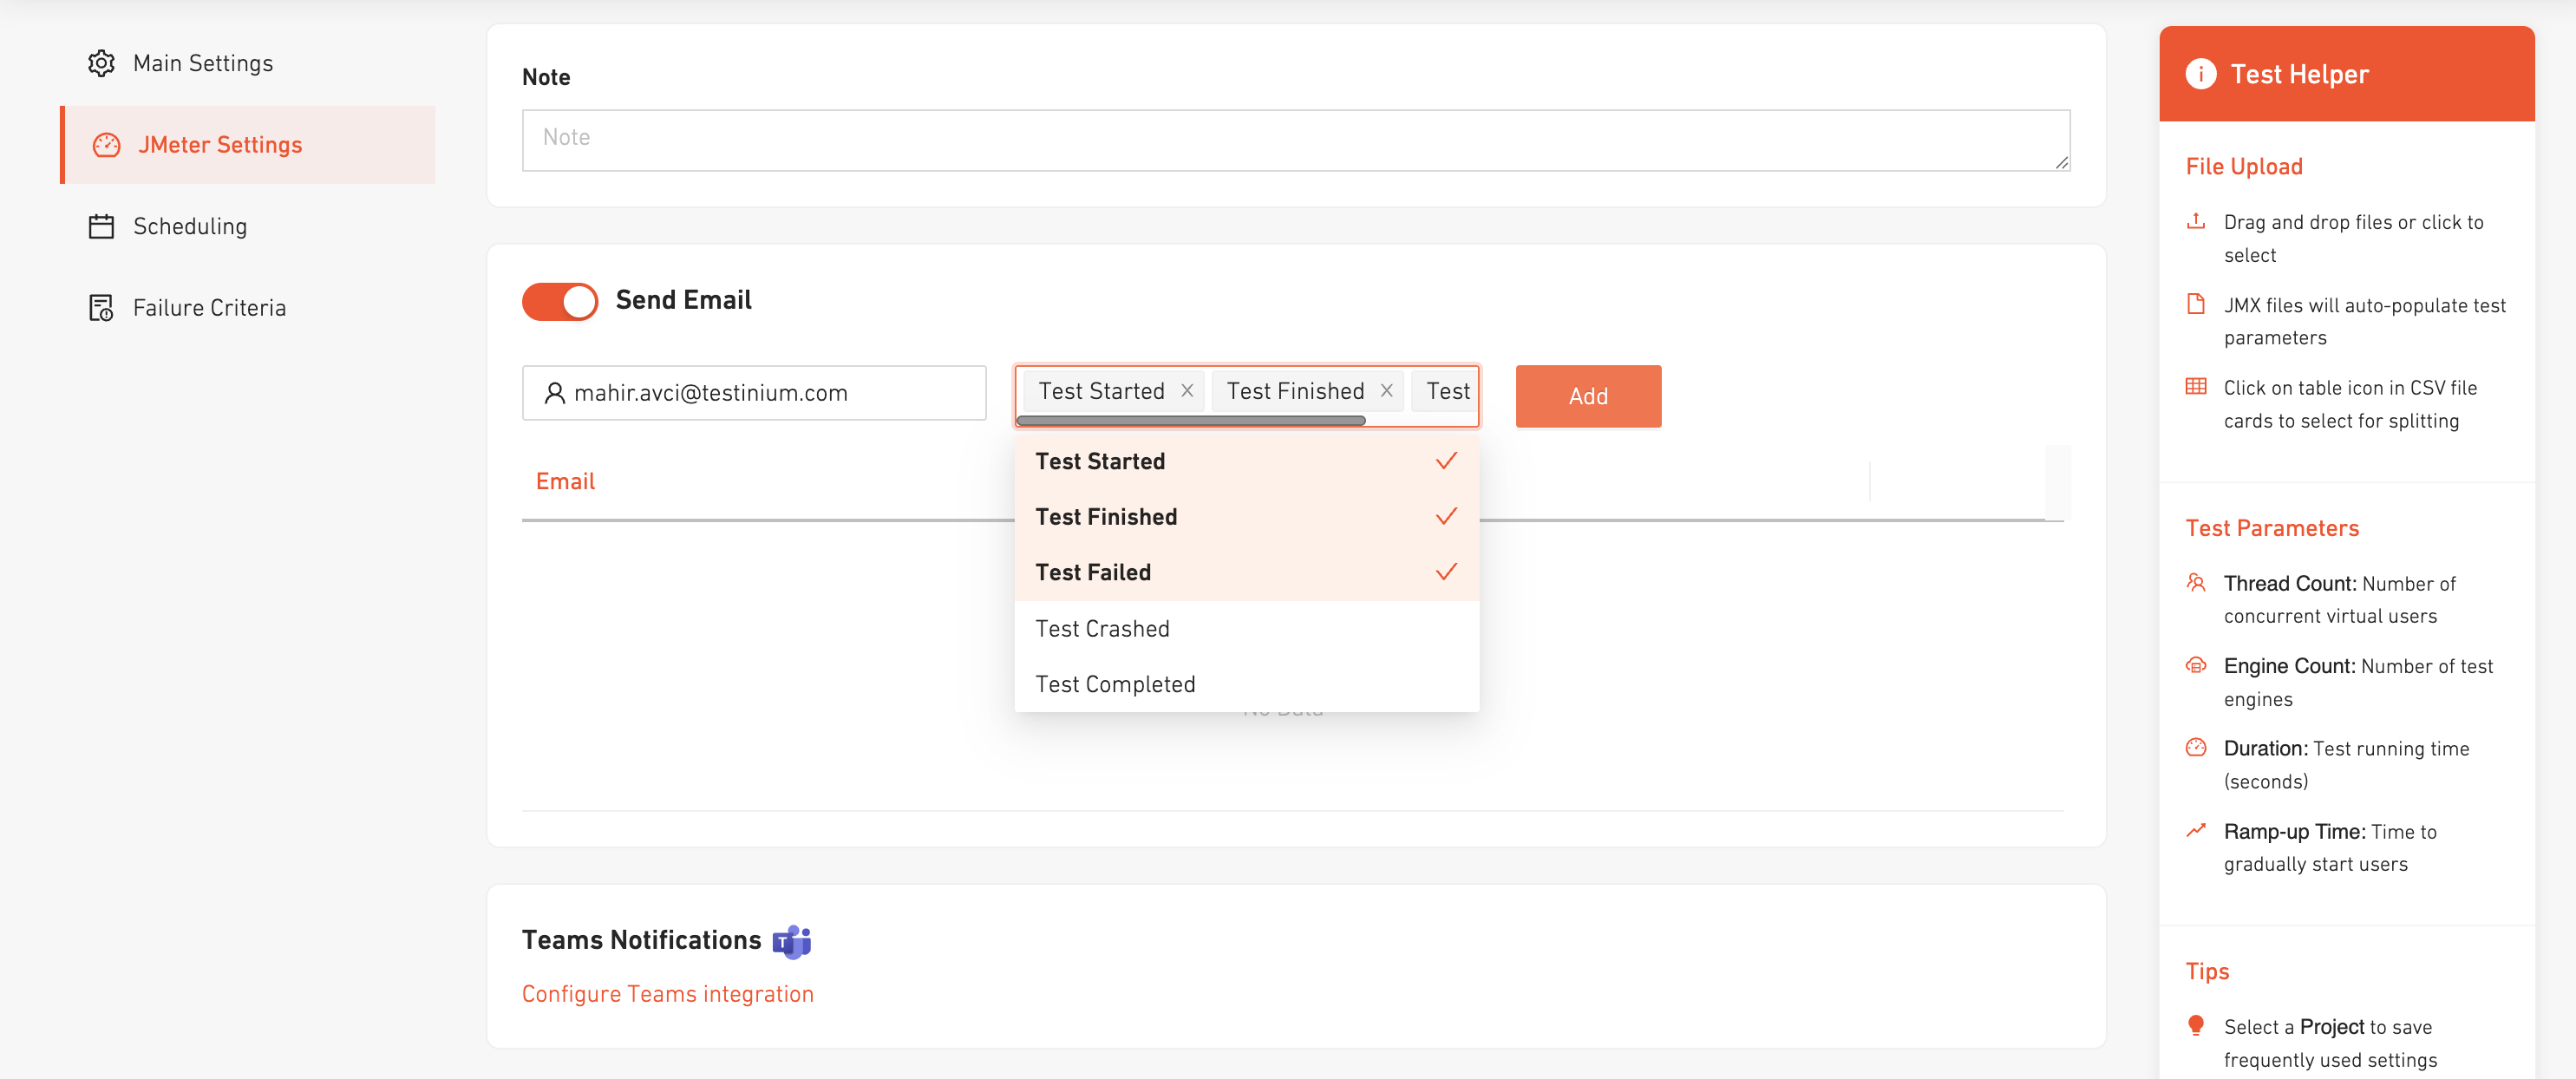
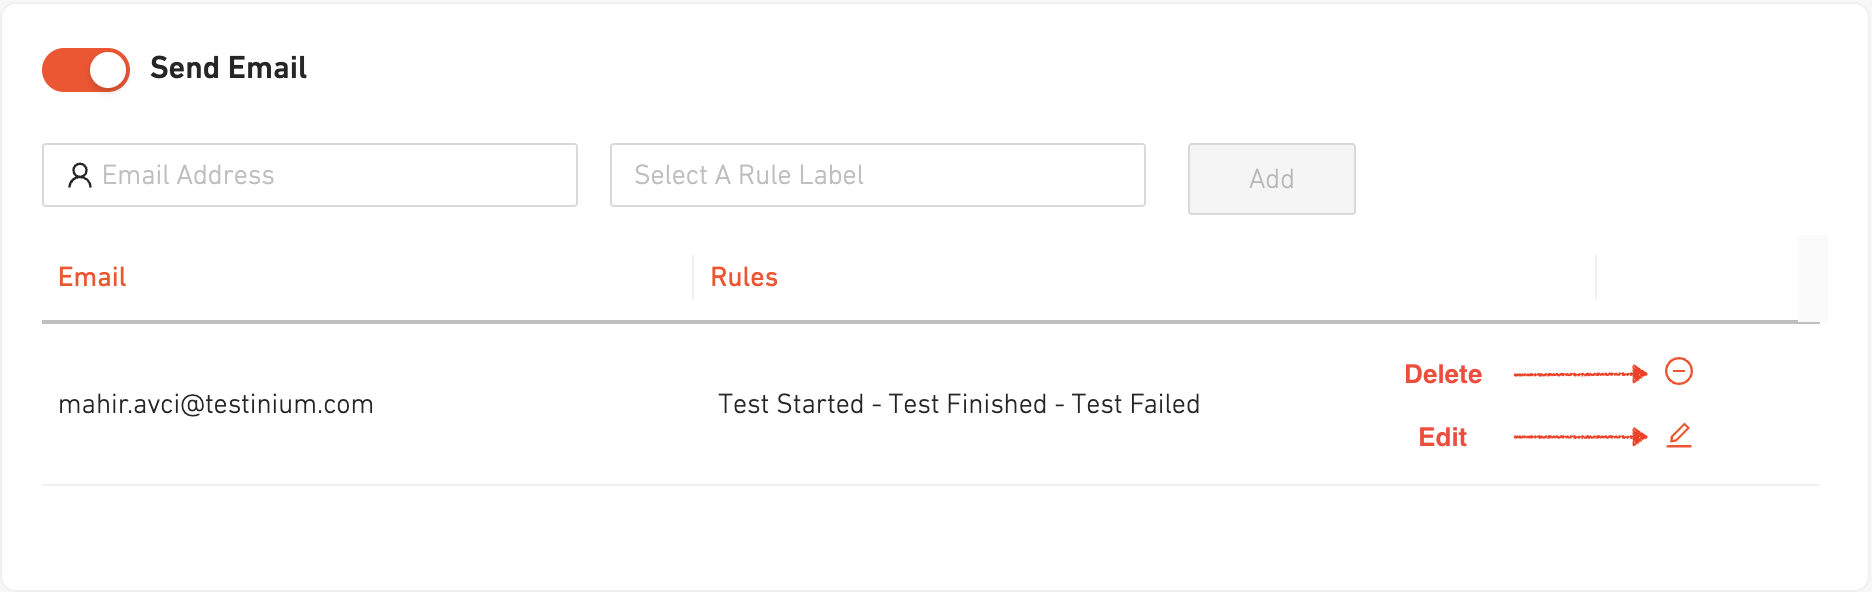
**Send Email:** In case you would like to be notified by e-mail after the test ends, you can enable this feature. You can find detailed information about this feature, [here](https://wiki.loadium.com/creating-test-on-loadium/send-email).

**Teams Notifications:** Integrate your Microsoft Teams Webhook to receive Loadium event alerts in your communication channels to stay informed.

**DNS Override:** Use this setting to specify alternative IP addresses for hostnames used in your test scenario. Entries here will be placed in the /etc/hosts file of each engine participating in the load test.

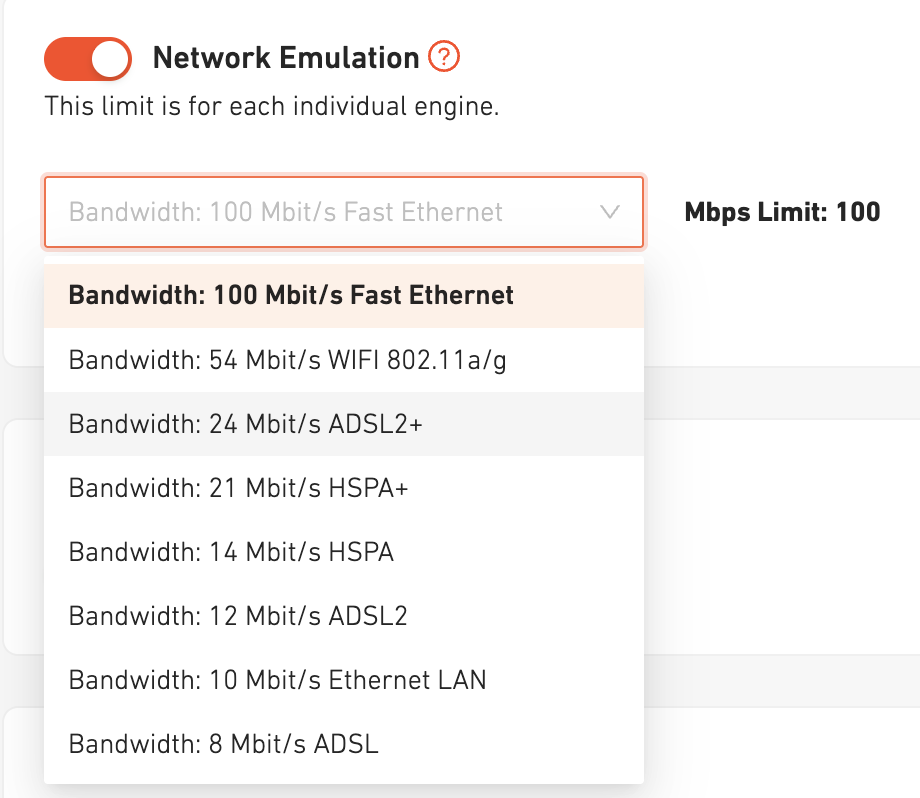
**Network Emulation:** Loadium lets you choose different network types to simulate network behavior by imitating the bandwidth and network delays. They all have different bandwidth and network delay values. In case nothing is selected, by default Wifi is set to all engines. You can find more detailed information on the Network Type page.

{% content-ref url="/pages/-MUSEFVcdAxjbYYkzFHy" %}
[Network Type old](/test-settings/what-is-network-type-old)
{% endcontent-ref %}

**JMeter Version:** Choose the JMeter version where you implemented your test scripts.

#### You can check out the following pages for additional test settings:

{% content-ref url="/pages/BEfmqciHro6t7IOoXW1D" %}
[JMeter Settings OLD](/test-settings/jmeter-settings-old)
{% endcontent-ref %}

{% content-ref url="/pages/O5a67xhVQrRdZaayfGEA" %}
[Test Scheduling old](/test-settings/test-scheduling-old)
{% endcontent-ref %}

{% content-ref url="/pages/CDD5Gw1xs3k317iv9ZFt" %}
[Failure Criteria old](/test-settings/failure-criteria-old)
{% endcontent-ref %}


# Locust Test

## What is Locust?

Locust is an open-source load testing and performance testing framework designed to measure how systems behave under load using scenarios primarily written in Python. It allows you to simulate user behavior to evaluate the scalability of web applications, APIs, and other systems.

For more information, you can visit [Locust’s website](https://locust.io/) and [GitHub](https://github.com/locustio/locust) repository.

## How does Locust work in Loadium?

You can upload your Locust test files as a ZIP through the Loadium interface. Running on Loadium will enable your Locust tests to run tests across multiple regions and handle high load levels.

Loadium uses Locust version 2.29.1. If you require a different version, you can forward your request to Loadium's support.

Loadium's current Python version is 3.12.x.

## Creating a test in Loadium

To create a test,&#x20;

* Go to [Loadium New Test](https://loadium.io/new-test) page
* Choose "Locust" test type
* Upload your Locust project files as a ZIP
* Enter your configurations (test name, virtual user amount, load regions etc.)

{% hint style="info" %}
**The locustfile.py file in the uploaded ZIP will be launched on the server. Therefore, the "main" file (where the test execution steps are placed) of your test must be named "locustfile.py".**
{% endhint %}

If your test depends on other files (such as reading data from CSV files), you should import them using the path format:

/locust/tests-files/{file path}

Example: Use `import(/locust/tests-files/abc.csv)` instead of `import(abc.csv)`

## Basic Example

```python
# locustfile.py

from locust import HttpUser, TaskSet, task, between
import json

class UserBehavior(TaskSet):
    """
    Defines the tasks that each simulated user will perform.
    """

    @task(2)  # This task has a weight of 2
    def get_items(self):
        """
        Perform a GET request to retrieve items.
        """
        self.client.get("/api/items", name="GET /api/items")

    @task(1)  # This task has a weight of 1
    def create_item(self):
        """
        Perform a POST request to create a new item.
        """
        payload = {
            "name": "New Item",
            "description": "This is a new item.",
            "price": 19.99
        }
        headers = {'Content-Type': 'application/json'}
        self.client.post("/api/items", data=json.dumps(payload), headers=headers, name="POST /api/items")

    def on_start(self):
        """
        Code to run when a simulated user starts executing tasks.
        Useful for setup tasks like authentication.
        """
        # Example: Authenticate and store a token
        # response = self.client.post("/api/login", json={"username": "testuser", "password": "testpass"})
        # if response.status_code == 200:
        #     self.token = response.json()["token"]
        #     self.client.headers.update({"Authorization": f"Bearer {self.token}"})
        pass

    def on_stop(self):
        """
        Code to run when a simulated user stops executing tasks.
        Useful for teardown tasks like logging out.
        """
        pass

class WebsiteUser(HttpUser):
    """
    Defines the user class that will run the tasks.
    """
    tasks = [UserBehavior]
    wait_time = between(1, 5)  # Simulate a wait time between 1 and 5 seconds between tasks
    host = "http://your-api-domain.com"  # Replace with your target host
```

## CSV Usage Example

```python
import csv
import logging
from locust import HttpUser, SequentialTaskSet, task, between

logger = logging.getLogger(__name__)

class UserBehaviour(SequentialTaskSet):

    def __init__(self, parent):
        super().__init__(parent)
        self.credentials = []  # Store user credentials from CSV
        self.current_index = 0  # Track the next user in a round-robin manner
    
    def load_credentials_from_csv(self):
        """ Load user credentials from CSV file """
        with open('/locust/test-files/testUser.csv', mode='r') as file: #This filepath is important
            reader = csv.DictReader(file, delimiter=';')
            self.credentials = list(reader)
        logger.info(f"Loaded {len(self.credentials)} users from CSV.")
        
    def get_next_user(self):
        """ Retrieve the next user from the credential list in a cyclic manner """
        user = self.credentials[self.current_index]
        self.current_index = (self.current_index + 1) % len(self.credentials)  # Loop back if at the end
        return user
        
    @task
    def login(self):
        """ Perform a login request with user credentials """
        user = self.get_next_user()  # Get next user credentials
        response = self.client.post(
            f"/index.php?route=account/login.login&language=en-gb&login_token={self.login_token}",
            name="Login",
            verify=False,
            data={
                "email": user["mail"],
                "password": user["password"]
            }
        )
        Verify.check_response(response)
        logger.info(f"Login request with Username: {user['mail']}, Password: {user['password']}")
        

class MyUser(HttpUser):
    """ Define user behavior and test configuration """
    wait_time = between(1, 2)
    host = "https://demo-opencart.com"
    tasks = [UserBehaviour]
```

## Logging Example

```python
import logging
from locust import HttpUser, task, between

# Configure logger
logging.basicConfig(
    level=logging.INFO,  # Set logging level
    format="%(asctime)s - %(levelname)s - %(message)s"
)

logger = logging.getLogger(__name__)  # Create logger instance

class UserBehavior(HttpUser):
    wait_time = between(1, 2)  # Random wait time between requests
    host = "https://example.com"  # Target website

    @task
    def example_task(self):
        """ Send a simple GET request """
        response = self.client.get("/")  # Perform GET request
        if response.status_code == 200:
            logger.info("Request successful")  # Log success
        else:
            logger.error(f"Request failed with status {response.status_code}")  # Log failure
```

```python
# Example log messages
logger.debug("This is a debug message")  # Debug message
logger.info("This is an info message")   # Info message
logger.warning("This is a warning message")  # Warning message
logger.error("This is an error message")  # Error message
logger.critical("This is a critical message")  # Critical error message
```

### Logs in Loadium Report

<figure><img src="/files/TvAVBUk1amYA9dV8DeM4" alt=""><figcaption></figcaption></figure>

## Running the test

To start the test, click the play button on the relevant screen. After a final review on the summarization window, you can initiate the execution.

After approximately 30 seconds, load generators will be ready and you’ll be taken to the report screen and the test will start.

In the report screen, you can click the red “X” button at the top at any time to stop the test. If you do not stop the test manually, it will run for the duration you specified and then stop automatically.

On the report screen, the data coming from your selected regions is displayed in 1-second intervals and visualized in charts. If you wish, you can export these reports. Your reports are stored and protected by Loadium according to your subscription plan.


# Script Builder

Loadium Script Builder is a feature that aims to ease and quicken your load test preparation in terms of scripting.

## Getting Started

There are 2 ways to utilize from Script Builder:

1. [You can create a script from scratch by creating HTTP Requests manually](#requests)
2. [You can import supported files (Swagger, HAR, Loadium Recorder, Postman)](#import)

You can go to Create Page and choose Script Builder to start creating a test.

<figure><img src="/files/eIKhaEpYqwYqB43jXfTq" alt=""><figcaption></figcaption></figure>

## Creating a Script

### Import

Loadium supports four different file types for importing into Script Builder.

Supported file types for import:

* **Postman Collection** – Exported collection of API requests from Postman.
* **HTTP Archive (HAR)** – Captured network traffic in HAR format.
* **Swagger (OpenAPI)** – API definitions in Swagger/OpenAPI specification.
* **Loadium Recorder File** – Files recorded using the Loadium Chrome extension.

<figure><img src="/files/rdbSFheP7N5KHyNQDZlA" alt=""><figcaption></figcaption></figure>

#### Postman

By uploading your Postman collection to the script generator, you can easily organize it and make it ready for load testing. You can upload multiple collections at once.

<div><figure><img src="/files/H2EYCimLT1ugiwyUfRrE" alt="" width="375"><figcaption></figcaption></figure> <figure><img src="/files/4ge58luLABr4ThOJvoUW" alt="" width="375"><figcaption></figcaption></figure></div>

Here is a preview of the script editor screen after the uploading is completed.

<figure><img src="/files/88oMLDbUxBXeH2YveunV" alt=""><figcaption></figcaption></figure>

#### HTTP Archive (HAR)

Similar to Postman, you can easily import your files with the ".har" extension into the script generator.

<figure><img src="/files/lspOPh98J4YzpUFGedf3" alt="" width="375"><figcaption></figcaption></figure>

<figure><img src="/files/YjLQwP7jCIg0o6k3Tvz0" alt=""><figcaption></figcaption></figure>

#### Swagger

Loadium allows you to import your Swagger by uploading your Swagger file or using your Swagger URL.

<figure><img src="/files/Na0vZj1WivKrUgW0Zq7I" alt="" width="375"><figcaption></figcaption></figure>

<div><figure><img src="/files/MUF0brjKiV9qcw9BGKEz" alt="" width="375"><figcaption></figcaption></figure> <figure><img src="/files/nVIcIN9nNpMtT2gaHm4R" alt="" width="375"><figcaption></figcaption></figure></div>

#### Loadium Recorder (Google Chrome Extension)

Allows you to record HTTP requests, URLs, their parameters, and headers while you are browsing the web.

{% tabs %}
{% tab title="Installing the Recorder" %}

#### Installing the Extension

You can find the page for installing the extension to Google Chrome [here](https://chrome.google.com/webstore/detail/loadium-extension/eecaejegccegjjjngokgelmehfkmpico/related).

After installing the extension, remember to pin it from the extension manager.

&#x20;                                                  <img src="/files/-MZGvXcyHGQL5fU09D0t" alt="" data-size="original">

Now you can easily access to Record\&Play.
{% endtab %}

{% tab title="Recorder UI" %}
A quick tour of the extension’s interface.&#x20;

![](/files/-MZGx7uFmZfgae6E2X-B)

You can find the explanation below for each numbered button:

1. These buttons (start button and the big orange button) will **start the recording** session, as you browse, it will add requests to the Collections section. Once the recording is started, you will notice that its icon has changed.

   &#x20;                                             <img src="/files/-MZGzQbqaRfAXzaxJC6V" alt="" data-size="original">&#x20;
2. If you want to **clear the recording**, you can use this button to wipe the collections you previously recorded.
3. You can **download the recording** by using this button, as .json file.
4. Pressing this button will take you to **settings** of recording.

   These settings allows you to filter your recordings. You can define a regex pattern in order to capture specific URL’s. For example entering pattern as “https\://\*.youtube.com/\*” will record URL’s that contains “youtube.com” in it. Furthermore, you can choose to record only the top level requests or additional sub-level requests.
5. This button will **create a new set of collection** next to your previous collection, which the new recordings will be added to this new collection.
6. This button will take you to the **Login Page**, if you’re logged in you will see your email address here.
7. If you’re logged in, clicking this button will take you to **Loadium Record\&Play Page**, then you can start editing your recorded requests, or directly save\&run your test.
   {% endtab %}
   {% endtabs %}

## **Editing Script**

You can start editing your script after you've followed one of the processes:

* Pressing "Create" button,
* Importing via Postman, HAR file, Swagger, or Loadium Recorder..

<figure><img src="/files/pEtjguAY8HkwyjfHgBh0" alt=""><figcaption></figcaption></figure>

{% hint style="warning" %}
Make sure to save your script after making major changes to avoid losing any progress.
{% endhint %}

### **Collections**

Collections allow you to separate the script into smaller pieces, making it easier to work with. Similar to Thread Groups in JMeter, you can add multiple collections to organize different parts of your test scenario independently. You can create collections by clicking "***+ New***" button.

<figure><img src="/files/osXyrEcK8ZB5i3MK7dFo" alt="" width="375"><figcaption></figcaption></figure>

You can add multiple collections if you want. For each collection, you can:

<figure><img src="/files/IEtavPQtTDmYrzPDvwlG" alt="" width="375"><figcaption></figcaption></figure>

* Add a new request which then you can configure its details.

<figure><img src="/files/FGfZ7hKBfqqauc822Z12" alt="" width="375"><figcaption></figcaption></figure>

* Add sleep which adds a delay before the next request. You can enter the delay amount (in milliseconds) as you desire.

<figure><img src="/files/c63fYX5FRgbPMLLi8Ugk" alt="" width="375"><figcaption></figcaption></figure>

* Edit the label of your collection.
* Duplicate the collection.
* Delete the collection if you would like to.

For each request in the collection, you can:

<figure><img src="/files/upb2RHMxvvRmmWvwvgl7" alt="" width="375"><figcaption></figcaption></figure>

* **Edit** the request
* **Duplicate** the request
* **Delete** the request from collection

You can also change the position of requests by gripping them, to change their order or group them in a collection.

### **Requests**

{% tabs %}
{% tab title="Basics" %}

#### **Method Type**

You can set request types as GET, POST, PUT, PATCH, DELETE, and OPTIONS.

#### **Query Params**

You can add query parameters to your request as shown in the picture.

<figure><img src="/files/29xVwaj7xojscfkr35MG" alt=""><figcaption></figcaption></figure>

#### Body

Depending on the method type, you can manage its body to send data with the request.

<figure><img src="/files/RHUaqhL2ZbXLYPCXVOvJ" alt=""><figcaption></figcaption></figure>

#### **Headers**

<figure><img src="/files/P268TXqbqjM80IEZypRf" alt=""><figcaption></figcaption></figure>

You can add a new header or delete the existing ones.

* To remove a header, use the Delete (trash can) icon located at the end of the corresponding row.
* To add a new header, click the "+" button located at the top right, and specify the Key and Value fields.
* To bulk edit request headers, click "Bulk Edit" button at the top right corner.

<figure><img src="/files/9DRfbfmACfkLF5u3oAX2" alt=""><figcaption></figcaption></figure>
{% endtab %}

{% tab title="Variables" %}
You can create variables that allows you to capture a specific data from a request’s response and store it for using later.

There are 3 ways of expression to capture the data to store it in a variable:

* JSON Path
* Regex
* CSS Selector

<figure><img src="/files/h0oKNDqw8eLYKWFnpPdd" alt=""><figcaption></figcaption></figure>

For each type there are areas to be filled, Variable Name and Expression (Attribute for CSS selector). The referred data will be stored in the variable.

For CSS Selector, there are 2 additional areas that are related to capturing the data.

* The referenced CSS element might have multiple values, attribute is for specifying to which value to restore. Leaving it empty will capture the text value of the element.
* Match number is for choosing one outcome if there are more than one reference. Value “0” is used for random outcome.                                   &#x20;

You can access the created variable’s value with the expression ${variableName}.
{% endtab %}

{% tab title="Assertions" %}
You can make various type of assertions that uses response data to check conditions:

<figure><img src="/files/slDgfim5zNUSmOEL0dBn" alt=""><figcaption></figcaption></figure>

* **HTTP Status Code** assertion, allows you to assert the value of the response code.&#x20;
* **Body** assertion, allows you to assert the body of a response.
* **Headers** assertion, allows you to assert the header of a response
* **JSON Path Value** assertion, allows you to capture a value using a json path expression, then compare it to expected result
* **JSON Path Assertion**, asserts that the given json path expression contains value, is not null.
  {% endtab %}
  {% endtabs %}

## **After Editing**

At the bottom of the page, you will see 2 buttons.

<figure><img src="/files/3Z7W9MJYQxDmO7iyfW8q" alt=""><figcaption></figcaption></figure>

* Clicking either "Save Test" or "Run Test" will redirect you to the Main Settings tab on the New Test page, with your .jmx file uploaded and ready to run.

<figure><img src="/files/sOvktity99183AXebkJV" alt=""><figcaption></figcaption></figure>

* You can also configure your test settings before saving your test by clicking ***Test Settings** tab.*

<figure><img src="/files/VUVJpaBOB1zGBtWn9EWJ" alt=""><figcaption></figcaption></figure>

* You can also download the file as JMX or JSON (Loadium Recorder) file.

<figure><img src="/files/StkwLdG7ERLxOw63VLlx" alt="" width="365"><figcaption></figcaption></figure>

### Global Variables

You can define global variables to be used within requests when necessary. Utilizing this will make it easier when you need to constantly change some values within requests (for example, changing target URL from test environment to production environment).

<figure><img src="/files/akrOU2hzeFKggSIJ00k0" alt="" width="375"><figcaption></figcaption></figure>

#### Input Fields

* **Variable:** Name of the variable to be referenced for usage.
* **Value:** Value stored in the variable
* **Description:** Entering some self-explanatory notes about the created variable

### CSV Upload

Similar to JMeter, Script Builder supports CSV file upload so you can use dynamic data in your tests by referencing predefined values from your dataset.

<figure><img src="/files/wWBV5o25j2Q9gcGdSQsc" alt="" width="375"><figcaption></figcaption></figure>

**Input Fields**

* **Variable Names:** Name of the variables to be referenced from CSV file (make sure to split your variable names by using ***comma***).
* **Delimeter:** The separator character used to split a dataset in a csv file.
* **Ignore first line:** Toggle this option if you have header line in your csv file.
* **Recycle on End of File:** Reuses the CSV data from the beginning after reaching the end.


# Script Builder (OLD)

Brief introduction for Loadium's online script editors

Loadium provides online web editor interfaces to ease the process of creating a load test script while adapting a zero-code approach. If you are new to load test scripting frameworks, Loadium's script editors are aimed to be easy to use and get things going faster.

This also allows teams to work with better cooperation by removing the hassle of passing script files constantly, your custom script will be available to edit whenever you log in to Loadium.

There are 2 types of editors on Loadium.

## 1) HTTP Builder

This one is aimed to be very simple where you will give inputs manually such as Target URL, Timeouts, Method Type, Body, etc.

{% content-ref url="/pages/-MUSBrNVrAlMwDQwoAG6" %}
[Simple HTTP Builder](/create-test/script-builder-old/http-test)
{% endcontent-ref %}

## 2) Record & Play

This one has 2 types of usages.

The first one is similar to HTTP Builder but will allow more customization, such as creating global variables, changing request's order dynamically, adding delays between requests etc.

The second usage is with the web surfing recorder which is a Chrome extension that can be installed, where your recorded request will be transferred to the editor to tailor bigger scripts.

{% content-ref url="/pages/-MZDGn7b1fvU2nxsA08m" %}
[Script Builder](/create-test/loadium-record-and-play)
{% endcontent-ref %}


# Simple HTTP Builder

A quick guide for creating test with Simple HTTP Builder

You can go to Create Page and choose Script Builder > Simple HTTP Builder to start creating a test.

## 1) **Setting Up Requests**

This panel allows users to create POST, PUT, GET and DELETE requests via the web editor.

<figure><img src="/files/4jv6MefgN56W3nseyk4V" alt=""><figcaption></figcaption></figure>

* **Name:** It’s the name of the request to be seen in the report. It’s a mandatory field.
* **URL:** URL or End-point of the service. It’s a mandatory field.
* **Response Timeout & Connect Timeout:** They are not necessary for every request. They can be left blank in case unknown. In case they are set to some specific values, they will be used as an assertion for request. In case those values are reached during test execution, the request will be marked as failed.
* **Header Name & Header Value:** They must be set according to your request. In case unknown, they can be left blank.
* **Body:** Only available with POST and PUT type requests. You should enter the payload/message you want to send to your request in that field.

## **2) Configuration**

Configuration panel allows you to set the size and progression of your load test. Depending on the configuration set here, the behavior of the load will be determined. In case you want to override Loadium parameters, tick the checkbox next to each parameter to use the uploaded JMeter script’s configuration.

<figure><img src="/files/5cTxtIyxlrYVtobTpXdD" alt=""><figcaption></figcaption></figure>

* **Total Users:** Total amount of virtual users that are going to execute the script. Calculated by Engine Count \* Users Per Engine
* **Engine Count:** Amount of engines that will be used for the test execution.&#x20;
* **Users Per Engine:** This parameter lets you define the thread number to create in each load engine.&#x20;
* **Ramp-Up Time:** The amount of time that should pass (in seconds) to reach the total users, starting from 0 threads. Threads increase linearly.

{% hint style="info" %}
🙌🏻  **Example:** In case you have 500 total users and 10 seconds ramp-up time, for every second, 50 threads will be generated by Loadium.
{% endhint %}

* **Iteration:** Number of the script executions will be iterated by virtual users.
* **Duration:** Test period (in minutes) for Loadium to execute.&#x20;

{% hint style="warning" %}
**Note:** The test will be concluded whichever is reached first; test duration or iteration.

The test can be concluded before the iteration count is reached, due to the duration being reached. The same rule applies to vice versa. If all iterations are completed before the defined duration, the test will be concluded.
{% endhint %}

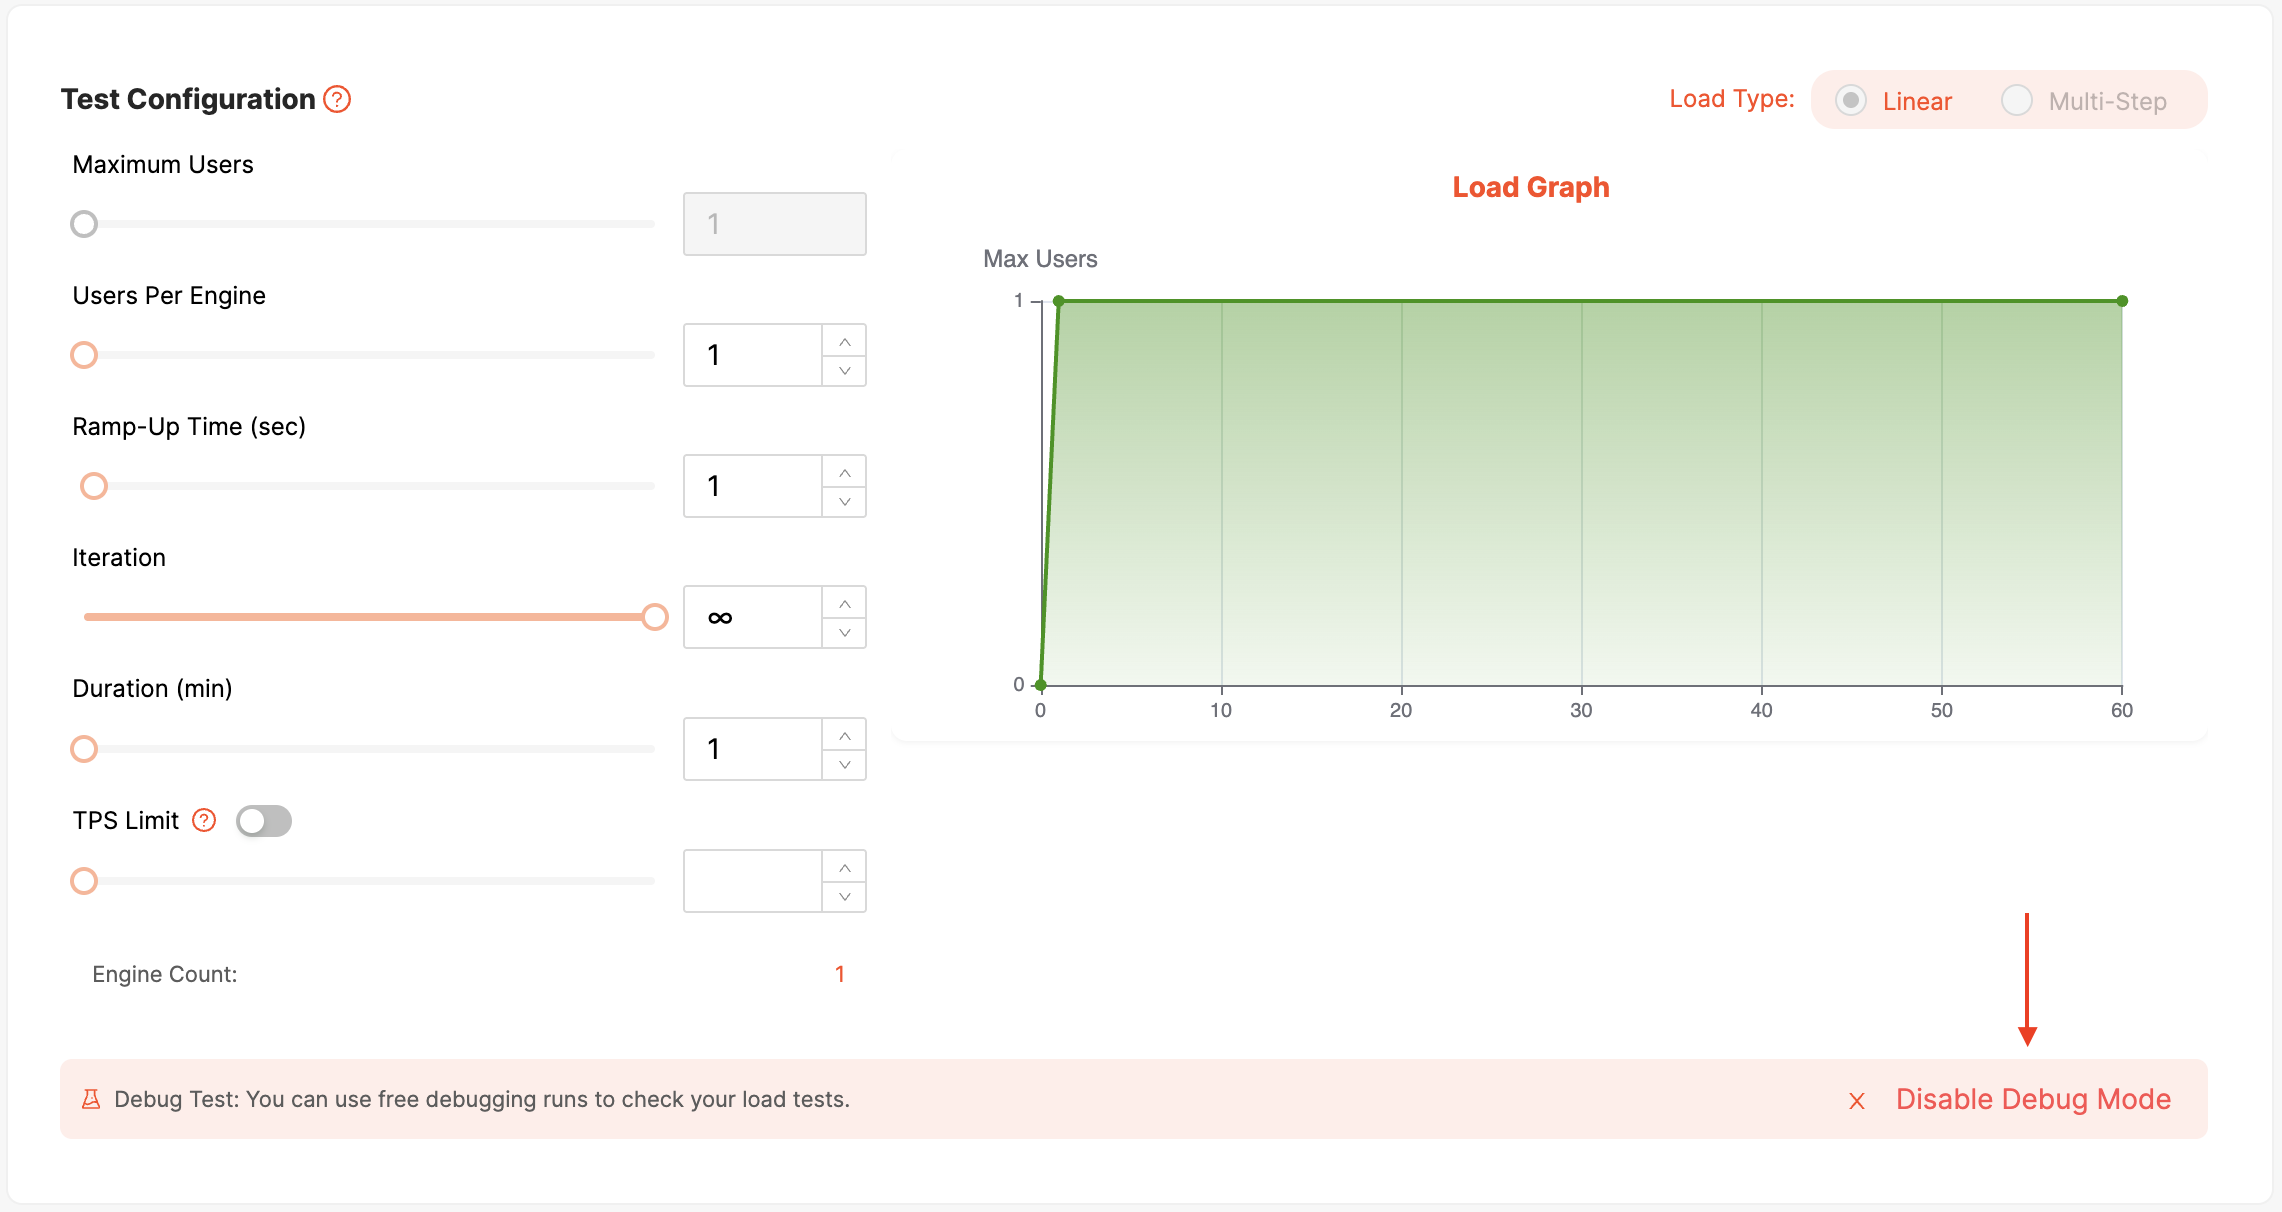
* **Sandbox Test:** Allows you to run <mark style="color:green;">free</mark> tests to debug your tests. If you just want to make sure that your system is ready for testing, or your script is properly working, you can enable this option (enabling sandbox test will limit the test configuration).

## **3) Geolocation**

#### Cloud Services

Loadium allows you to run globally distributed load tests by providing servers. Lets you select regions to execute situational user simulations. When a location is chosen, engines will be generated in that particular region and all requests will come from that region.

You can find more detailed information on the Geolocation page.

{% content-ref url="/pages/-MUSE7GXKewmLpQmOWWW" %}
[Geolocation old ui](/test-settings/what-is-geolocation)
{% endcontent-ref %}

#### Private Location

Instead of provided servers, Loadium allows you to create custom locations with [Docker](https://www.docker.com/) integration to run load tests from your personal servers.

You can find more detailed information on the Private Location page.

{% content-ref url="/pages/-MYABRi8YJLiiG9YuvpQ" %}
[Private Location old ui](/features/private-location)
{% endcontent-ref %}

## 4) Advanced Settings

**Dedicated IP:** If the system that is going to be tested has access limitations such as a firewall or DDoS protection, you can rent static IP’s and whitelist them to allow Loadium to perform a load test on the system. Enabling this option will run the test with the rented dedicated IP’s. To rent dedicated IP’s, please [contact our support](https://loadium.com/contact-us).

You can find more detailed information on the Dedicated IP page.

{% content-ref url="/pages/-MUSDlUqfBVdT1lh-1Bf" %}
[Dedicated IP old ui](/test-settings/what-is-dedicated-ip-old)
{% endcontent-ref %}

**JMeter Version:** Choose the JMeter version where you implemented your test scripts.

**Network Type:** Loadium lets you choose different network types to simulate network behavior by imitating the bandwidth and network delays. They all have different bandwidth and network delay values. In case nothing is selected, by default Wifi is set to all engines. You can find more detailed information on the Network Type page.

{% content-ref url="/pages/-MUSEFVcdAxjbYYkzFHy" %}
[Network Type old](/test-settings/what-is-network-type-old)
{% endcontent-ref %}

**Limit TPS:** This parameter allows you to limit the total throughput (requests happening per second) of the test’s execution. This limitation works on engines individually, so if you are using “X” amount of engines, the maximum throughput across all engines will be limited to X \* Limit Value. You can find more detailed information about TPS [here](/test-settings/what-is-tps).

You can find more detailed information on the TPS page.

{% content-ref url="/pages/-MUSE27VOvlt1xnKhF7z" %}
[TPS old ui](/test-settings/what-is-tps)
{% endcontent-ref %}

#### You can check out the following pages for additional test settings:

{% content-ref url="/pages/CDD5Gw1xs3k317iv9ZFt" %}
[Failure Criteria old](/test-settings/failure-criteria-old)
{% endcontent-ref %}

{% content-ref url="/pages/-MUheY65faqUboU8iwG4" %}
[Broken mention](broken://pages/-MUheY65faqUboU8iwG4)
{% endcontent-ref %}


# Gatling Test

A quick guide for creating Gatling test on Loadium

Gatling is an open-source performance testing framework, which uses Scala, Akka, and Netty as a technology stack and as its backbone. You can upload your previously created Gatling script to Loadium to run tests. You can go to Create Page and choose Gatling Test to start creating a test.

## 1) Basics

<figure><img src="/files/dYUMDieFruy8y2L48zKE" alt=""><figcaption></figcaption></figure>

* **Test Name** is a mandatory field as it will be referenced in future usage.
* **Project** is an optional field that allows you to assign your tests to a specific project in order to group them.&#x20;
* **Upload File** field let you upload a scala file from the upload file area. Whenever a test is saved, newly added files are uploaded to our servers. In case there’s an update, Loadium will automatically update the files by matching them by their file name.&#x20;

{% hint style="info" %}
**Note:** At least one scala file is mandatory to save a Gatling test.
{% endhint %}

**Split CSV File:** Select this option to split your CSV data into engines uniquely. You can find more detailed information about Split CSV [here](https://wiki.loadium.com/test-settings/what-is-split-csv).

{% hint style="info" %}
**Note:** The name of the CSV that you have uploaded and the name of the CSV in your scala file must be the same.
{% endhint %}

* **Notes:** Allows you to enter additional details and self-explanatory notes.
* **Send Email:** In case you would like to be notified by e-mail after the test ends, you can enable this feature. You can find detailed information about this feature, [here](https://wiki.loadium.com/creating-test-on-loadium/send-email).

## 2) Configuration

<figure><img src="/files/b5PXemGhwGPif8FTErpF" alt=""><figcaption></figcaption></figure>

* **Engine Count:** Amount of engines that will be used for the test execution.
* **Users Per Engine:** Amount of users (threads) that will be generated from each engine to execute the script.
* **Duration(min):** Total time for Loadium to execute Gatling scenarios.

{% hint style="info" %}
**Note:** Test run times can not exceed the duration you set but if your Gatling scenario ends the test will be automatically finished.
{% endhint %}

**Sandbox Test:** Allows you to run <mark style="color:green;">free</mark> tests to debug your tests. If you just want to make sure that your system is ready for testing, or your script is properly working, you can enable this option (enabling sandbox test will limit the test configuration).

## **3) Geolocation**

#### Cloud Services

Loadium allows you to run globally distributed load tests by providing servers. Lets you select regions to execute situational user simulations. When a location is chosen, engines will be generated in that particular region and all requests will come from that region.

You can find more detailed information on the Geolocation page.

{% content-ref url="/pages/-MUSE7GXKewmLpQmOWWW" %}
[Geolocation old ui](/test-settings/what-is-geolocation)
{% endcontent-ref %}

#### Private Location

Instead of provided servers, Loadium allows you to create custom locations with [Docker](https://www.docker.com/) integration to run load tests from your personal servers.

You can find more detailed information on the Private Location page.

{% content-ref url="/pages/-MYABRi8YJLiiG9YuvpQ" %}
[Private Location old ui](/features/private-location)
{% endcontent-ref %}

## 4) Advanced Settings

**Dedicated IP:** If the system that is going to be tested has access limitations such as a firewall or DDoS protection, you can rent static IP’s and whitelist them to allow Loadium to perform a load test on the system. Enabling this option will run the test with the rented dedicated IP’s. To rent dedicated IP’s, please [contact our support](https://loadium.com/contact-us).

You can find more detailed information on the Dedicated IP page.

{% content-ref url="/pages/-MUSDlUqfBVdT1lh-1Bf" %}
[Dedicated IP old ui](/test-settings/what-is-dedicated-ip-old)
{% endcontent-ref %}

**Gatling Version:** Choose the Gatling version according to your test script implementation.

{% hint style="info" %}
Recommended version of Gatling is 3.5.1
{% endhint %}

**Network Type:** Loadium lets you choose different network types to simulate network behavior by imitating the bandwidth and network delays. They all have different bandwidth and network delay values. In case nothing is selected, by default Wifi is set to all engines. You can find more detailed information on the Network Type page.

{% content-ref url="/pages/-MUSEFVcdAxjbYYkzFHy" %}
[Network Type old](/test-settings/what-is-network-type-old)
{% endcontent-ref %}

**Limit TPS:** This parameter allows you to limit the total throughput (requests happening per second) of the test’s execution. This limitation works on engines individually, so if you are using “X” amount of engines, the maximum throughput across all engines will be limited to X \* Limit Value. You can find more detailed information about TPS [here](/test-settings/what-is-tps).

You can find more detailed information on the TPS page.

{% content-ref url="/pages/-MUSE27VOvlt1xnKhF7z" %}
[TPS old ui](/test-settings/what-is-tps)
{% endcontent-ref %}

#### You can check out the following pages for additional test settings:

{% content-ref url="/pages/CDD5Gw1xs3k317iv9ZFt" %}
[Failure Criteria old](/test-settings/failure-criteria-old)
{% endcontent-ref %}

{% content-ref url="/pages/-MUheY65faqUboU8iwG4" %}
[Broken mention](broken://pages/-MUheY65faqUboU8iwG4)
{% endcontent-ref %}


# WebDriver Test

A quick guide for creating Selenium based Web Driver test on Loadium

WebDriver test screen has a built-in editor for users to change and implement their Java or JavaScript based test cases. You can go to Create Page and choose WebDriver Test to start creating a test.

## **1) Basics**

* Define a Test Name to your test script, this name will be used in reporting page as it’s and all metrics will be shown as aggregated under it.
* Choose the language that you do the WebDriver implementation. Right now, Loadium support Java and JavaScript.
* Implement the test script.

<figure><img src="/files/2qGTocviGJCmyueh4fBT" alt=""><figcaption></figcaption></figure>

{% hint style="info" %}
**Note:** If you want to add another test script, click the “Add New WebDriver Setup” button. You may create as many scripts as you want. Scripts will be executed by their order on the screen
{% endhint %}

## **2) Configuration**

Configuration panel allows you to set the size and progression of your load test. Depending on the configuration set here, the behavior of the load will be determined. In case you want to override Loadium parameters, tick the checkbox next to each parameter to use the uploaded JMeter script’s configuration.

<figure><img src="/files/5cTxtIyxlrYVtobTpXdD" alt=""><figcaption></figcaption></figure>

* **Total Users:** Total amount of virtual users that are going to execute the script. Calculated by Engine Count \* Users Per Engine
* **Engine Count:** Amount of engines that will be used for the test execution.&#x20;
* **Users Per Engine:** Amount of users (threads) that will be generated from each engine to execute the script.
* **Ramp-Up Time:** The amount of time that should pass (in seconds) to reach the total users, starting from 0 threads. Threads increase linearly.

{% hint style="info" %}
🙌🏻  **Example:** In case you have 500 total users and 10 seconds ramp-up time, for every second, 50 threads will be generated by Loadium.
{% endhint %}

* **Iteration:** Number of the script executions will be iterated by virtual users.
* **Duration:** Test period (in minutes) for Loadium to execute.&#x20;

{% hint style="warning" %}
**Note:** The test will be concluded whichever is reached first; test duration or iteration.

The test can be concluded before the iteration count is reached, due to the duration being reached. The same rule applies to vice versa. If all iterations are completed before the defined duration, the test will be concluded.
{% endhint %}

* **Sandbox Test:** Allows you to run <mark style="color:green;">free</mark> tests to debug your tests. If you just want to make sure that your system is ready for testing, or your script is properly working, you can enable this option (enabling sandbox test will limit the test configuration).

## **3) Geolocation**

#### Cloud Services

Loadium allows you to run globally distributed load tests by providing servers. Lets you select regions to execute situational user simulations. When a location is chosen, engines will be generated in that particular region and all requests will come from that region.

You can find more detailed information on the Geolocation page.

{% content-ref url="/pages/-MUSE7GXKewmLpQmOWWW" %}
[Geolocation old ui](/test-settings/what-is-geolocation)
{% endcontent-ref %}

#### Private Location

Instead of provided servers, Loadium allows you to create custom locations with [Docker](https://www.docker.com/) integration to run load tests from your personal servers.

You can find more detailed information on the Private Location page.

{% content-ref url="/pages/-MYABRi8YJLiiG9YuvpQ" %}
[Private Location old ui](/features/private-location)
{% endcontent-ref %}

## 4) Advanced Settings

**Dedicated IP:** If the system that is going to be tested has access limitations such as a firewall or DDoS protection, you can rent static IP’s and whitelist them to allow Loadium to perform a load test on the system. Enabling this option will run the test with the rented dedicated IP’s. To rent dedicated IP’s, please [contact our support](https://loadium.com/contact-us).

You can find more detailed information on the Dedicated IP page.

{% content-ref url="/pages/-MUSDlUqfBVdT1lh-1Bf" %}
[Dedicated IP old ui](/test-settings/what-is-dedicated-ip-old)
{% endcontent-ref %}

**JMeter Version:** Choose the JMeter version where you implemented your test scripts.

**Network Type:** Loadium lets you choose different network types to simulate network behavior by imitating the bandwidth and network delays. They all have different bandwidth and network delay values. In case nothing is selected, by default Wifi is set to all engines. You can find more detailed information on the Network Type page.

{% content-ref url="/pages/-MUSEFVcdAxjbYYkzFHy" %}
[Network Type old](/test-settings/what-is-network-type-old)
{% endcontent-ref %}

**Limit TPS:** This parameter allows you to limit the total throughput (requests happening per second) of the test’s execution. This limitation works on engines individually, so if you are using “X” amount of engines, the maximum throughput across all engines will be limited to X \* Limit Value. You can find more detailed information about TPS [here](/test-settings/what-is-tps).

You can find more detailed information on the TPS page.

{% content-ref url="/pages/-MUSE27VOvlt1xnKhF7z" %}
[TPS old ui](/test-settings/what-is-tps)
{% endcontent-ref %}

## More Settings

You can check out the following pages for additional test settings:

{% content-ref url="/pages/CDD5Gw1xs3k317iv9ZFt" %}
[Failure Criteria old](/test-settings/failure-criteria-old)
{% endcontent-ref %}

{% content-ref url="/pages/-MUheY65faqUboU8iwG4" %}
[Broken mention](broken://pages/-MUheY65faqUboU8iwG4)
{% endcontent-ref %}


# HLS Test

HLS Test allows you to execute performance tests on your on-demand or live-streaming video services.

After logging into Loadium, follow the path Create —> HLS Testing to create a video stream test.

<figure><img src="/files/pUmt6SzFcMejdnBSVQcc" alt=""><figcaption></figcaption></figure>

#### Video Stream Settings

<figure><img src="/files/W1Z1nTBxJeNxShMbfDMd" alt=""><figcaption></figcaption></figure>

**Manifest URL:** The URL here should be the manifest URL (.m3u8 or .mpd) which contains the main information of the video.

**Protocol:** Specifies the protocol to be used, HLS or MPEG-DASH. When choosing "Automatic", the configuration is made automatically based on the values ​​in the manifest URL.

**Resolution:** Specifies the resolution values ​​for the video. "Minimum" and "Maximum" options automatically set the resolution based on the values ​​in the manifest URL. Custom resolution allows specific values, but they must match one of the options contained in the manifest URL.

**Duration:** Specifies the duration of the video. Can be the entire video or a custom duration in seconds.

## Example

In our example, this URL value is “<https://vp.nyt.com/video/hls/2023/01/18/105584_1_opdoc-kitchen_wg/master.m3u8>".

<figure><img src="/files/UiObtlXLh79gBTQDx3Hg" alt=""><figcaption></figcaption></figure>

<figure><img src="/files/n41QgVCcoUGXS2L0zSEd" alt=""><figcaption></figcaption></figure>

#### Result

After all these configuration settings are made, we can start the test. We can use the “Request Stats” tab to see the results.

When we start the test after making the relevant settings, Loadium will start downloading the manifest and segment files from the specified URL.&#x20;

<figure><img src="/files/HEXV1ZAQgTZjU2ecHCSa" alt=""><figcaption></figcaption></figure>

When we examine the table on the Request Stats screen, we can see the effect of the load settings we made before the test on the test. There are 5 requests named "Loadium - Streaming Sampler - master playlist". These requests contain the audio and video files of the relevant URL.&#x20;

One of the values ​​we need to pay attention to in this type of test is the average data size. We can use the “Overview” field to see this value.&#x20;

![](/files/tclqGKPbdH2lZZfQiYIf)<br>

The value here shows us that our test downloaded an average of 2.42 MB of data per second. By multiplying the relevant value by the test duration, we can find out the size of the download made during the test period.

In this example, the test lasted 8 seconds. Therefore, it can be seen that the download we made during the test period was 8 x 2.42 MB = 19.36 MB in size.


# Understanding Test Reports

Loadium supports real-time reporting. It allows you to monitor performance metrics on tables and a graph layout.

### **Overview**

This screen allows you to monitor  Response Time, Hits & Errors,  Received Data and Sent Data graphs in real- time and presents basic test metrics such as: “Max User Number”, “Average Throughput”, “Total Error Number”, “Average Response Time”, “Average Received Bytes” and “Average Sent Bytes”&#x20;

![](https://firebasestorage.googleapis.com/v0/b/gitbook-x-prod.appspot.com/o/spaces%2F-MUOy4kHWrKkuqX5mhH7%2Fuploads%2F1Q7rO2jVvLOfLpHvFgWN%2Ffile.png?alt=media)

![](https://firebasestorage.googleapis.com/v0/b/gitbook-x-prod.appspot.com/o/spaces%2F-MUOy4kHWrKkuqX5mhH7%2Fuploads%2FcWHeVAXz40d3YkpeuQo9%2Ffile.png?alt=media)

![](https://firebasestorage.googleapis.com/v0/b/gitbook-x-prod.appspot.com/o/spaces%2F-MUOy4kHWrKkuqX5mhH7%2Fuploads%2FMkZKp7YVmCxgQLA5rwcI%2Ffile.png?alt=media)

### **Summary Report**

This screen shows KPI’s such as:&#x20;

* Total Hits , Average Response Time, Max Response Time, Min Response Time, Percentage Error, Total Throughput, Average Connect Time, Average Latency, Total Error Hits.&#x20;

![](https://firebasestorage.googleapis.com/v0/b/gitbook-x-prod.appspot.com/o/spaces%2F-MUOy4kHWrKkuqX5mhH7%2Fuploads%2FDtI0NFlu6twwpHfwt3um%2Ffile.png?alt=media)![](https://firebasestorage.googleapis.com/v0/b/gitbook-x-prod.appspot.com/o/spaces%2F-MUOy4kHWrKkuqX5mhH7%2Fuploads%2FWivR6OCd1R6DVDgSNg0J%2Ffile.png?alt=media)&#x20;

The KPIs shown in the table are as above&#x20;

* **Label:** Name of the request in JMeter.&#x20;
* **Total Hits:** Total number of requests sent to all services during the test.&#x20;
* **Avg Throughput/RPS:** The number of requests per second.&#x20;
* **Avg Response Time/Sec:** The average response time. &#x20;
* **%85 LINE-85th Percentile:** Response time of 85% of the samples were smaller than or equal to this response time.&#x20;
* **%90 LINE: 90th Percentile:** 90% of the samples were smaller than or equal to this response time.&#x20;
* **%95 LINE: 95th Percentile:** 95% of the samples were smaller than or equal to this response time.&#x20;
* **%99 LINE: 99th Percentile:** 99% of the samples were smaller than or equal to this response  time.&#x20;
* **Max Response Time/Sec:** Maximum response time for a user during the test.&#x20;
* **Min Response Time/Sec:** Minimum response time for one user during the test.&#x20;
* **Total Error Hits:** The number of all requests that received errors during the test.&#x20;
* **Avg.Connect Time/Sec:** Average connection time to server during the test.&#x20;
* **Avg.Latency/Sec:** Average server time during testing.&#x20;
* **Sent KB/Sec:** The amount of data sent per second.&#x20;
* **Received KB/Sec:** The amount of data received per second.&#x20;

### Timeline Report

This screen represents performance metrics on a timeline graph. By this way, users may observe any KPI changes on a timely basis. Users may correlate different KPI’s (Hits, Errors, Response Time, Virtual Users, Latency Time,Received Bytes and Sent Bytes”) to visualize on a graph.&#x20;

![](https://firebasestorage.googleapis.com/v0/b/gitbook-x-prod.appspot.com/o/spaces%2F-MUOy4kHWrKkuqX5mhH7%2Fuploads%2F3bVAugNOVp7vzZJlxAvm%2Ffile.png?alt=media)

![](https://firebasestorage.googleapis.com/v0/b/gitbook-x-prod.appspot.com/o/spaces%2F-MUOy4kHWrKkuqX5mhH7%2Fuploads%2FOYqxvn7JEjqIkgVUfz1O%2Ffile.png?alt=media)

If you select the KPI and request you want in the Timeline KPI Selection area, it will show the graph for you.&#x20;

### Response Codes

This screen shows the total number of response codes received during a performance test grouped by request.&#x20;

![](https://firebasestorage.googleapis.com/v0/b/gitbook-x-prod.appspot.com/o/spaces%2F-MUOy4kHWrKkuqX5mhH7%2Fuploads%2FG2UZ5p4B3fg2cQuBbeb2%2Ffile.png?alt=media)Engine Health: This screen shows the status of AWS server’s status aligned with Average CPU, Memory, Network Send / MB, Network Recv /MB&#x20;

![](https://firebasestorage.googleapis.com/v0/b/gitbook-x-prod.appspot.com/o/spaces%2F-MUOy4kHWrKkuqX5mhH7%2Fuploads%2FZOlo7SxIMk4uxL48xAqb%2Ffile.png?alt=media)

You can see the status of the machines graphically on the Engine Health report screen as shown above.&#x20;

### Failure Criteria

The Failure Criteria feature allows you to set your test's pass / fail criteria for various metrics, such as response time, errors, hits/s, test duration etc.&#x20;

![](https://firebasestorage.googleapis.com/v0/b/gitbook-x-prod.appspot.com/o/spaces%2F-MUOy4kHWrKkuqX5mhH7%2Fuploads%2FBImbRf5Ba8krWcwFqPpK%2Ffile.png?alt=media)

**Column 1 -** Specify here if you want to use this rule on a particular label from your script.  It's set to "ALL" (all labels) by default.&#x20;

**Column 2 -** Select the specific metric you'd like to apply a rule for.  Click the down arrow on the right side of the field to open a drop-down menu and review available metrics to monitor.&#x20;

**Column 3 -** The binary comparison operators for this rule, which includes "Less than", "Greater than", "Equal to", and "Not Equal to".  Click the down arrow on the right side of the field to open a drop-down menu.&#x20;

**Column 4 -** The numeric value you want this rule to apply to.&#x20;

**Stop Test -** If this box is checked, the test will stop immediately when that criteria fails; otherwise, it will continue running uninterrupted. &#x20;

![](https://firebasestorage.googleapis.com/v0/b/gitbook-x-prod.appspot.com/o/spaces%2F-MUOy4kHWrKkuqX5mhH7%2Fuploads%2FcoXtCT9l08mbwLxVluOI%2Ffile.png?alt=media)

### Logs

Users can download JMeter and Loadium logs on this page.&#x20;

![](https://firebasestorage.googleapis.com/v0/b/gitbook-x-prod.appspot.com/o/spaces%2F-MUOy4kHWrKkuqX5mhH7%2Fuploads%2FSKwqaF0IKmN6sB623RGE%2Ffile.png?alt=media)

### Errors

HTTP codes except for HTTP 200 will be shown on this screen. Users will be able to observe the total number of errors per HTTP status and its related transaction.&#x20;

![](https://firebasestorage.googleapis.com/v0/b/gitbook-x-prod.appspot.com/o/spaces%2F-MUOy4kHWrKkuqX5mhH7%2Fuploads%2FSswunv7U4hWfhwIZVggw%2Ffile.png?alt=media)

### Assertions

In case your JMeter scripts contain any assertions, this page will be populated with assertions whenever it fails. Any failed transaction will also show its reason of failure.&#x20;

![](https://firebasestorage.googleapis.com/v0/b/gitbook-x-prod.appspot.com/o/spaces%2F-MUOy4kHWrKkuqX5mhH7%2Fuploads%2F2iP68kQFI5RIgdvyBCc5%2Ffile.png?alt=media)

### APM Reports

You might check out APM integration on this tab.&#x20;

![](https://firebasestorage.googleapis.com/v0/b/gitbook-x-prod.appspot.com/o/spaces%2F-MUOy4kHWrKkuqX5mhH7%2Fuploads%2FYUU01WL4k5WQ3GjCVthh%2Ffile.png?alt=media)

![](https://firebasestorage.googleapis.com/v0/b/gitbook-x-prod.appspot.com/o/spaces%2F-MUOy4kHWrKkuqX5mhH7%2Fuploads%2FDrAOgo3mDq9wDqA3mueL%2Ffile.png?alt=media)


# AI Analysis

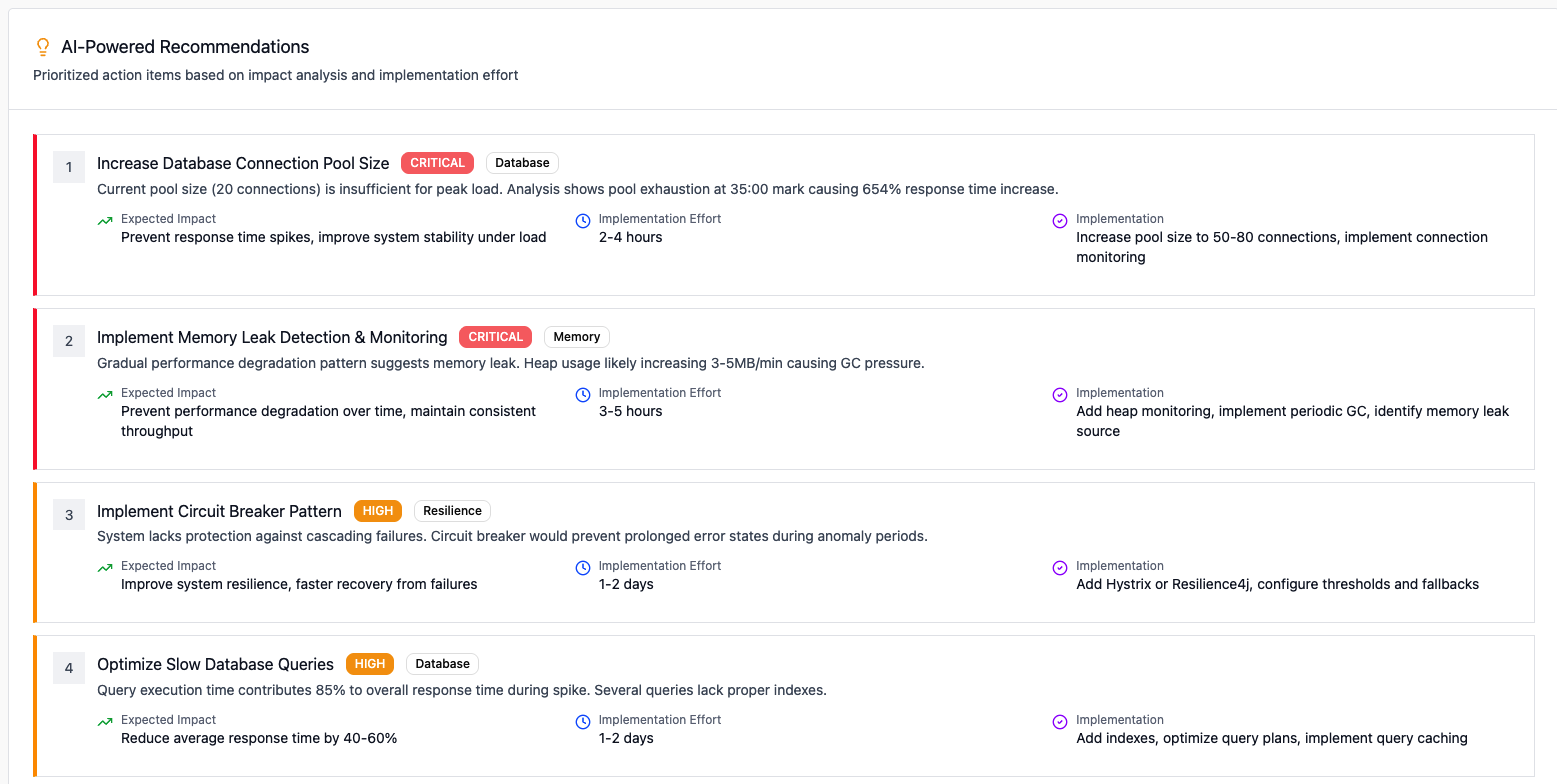
**Loadium AI Analysis** is an intelligent performance insight tool that allows you to utilize AI to analyze your test results and uncover meaningful insights without manual effort.

***

## What Does It Do?

Loadium AI Analysis helps you:

* Understand your test results faster by summarizing complex data
* Identify anomalies, slow transactions, and potential bottlenecks
* Ask natural language questions to get AI-generated insights on specific issues
* Navigate through your load test data with the help of Recommended or Custom questions

***

## How It Works

Once your load test is complete, Loadium will automatically analyze the results.

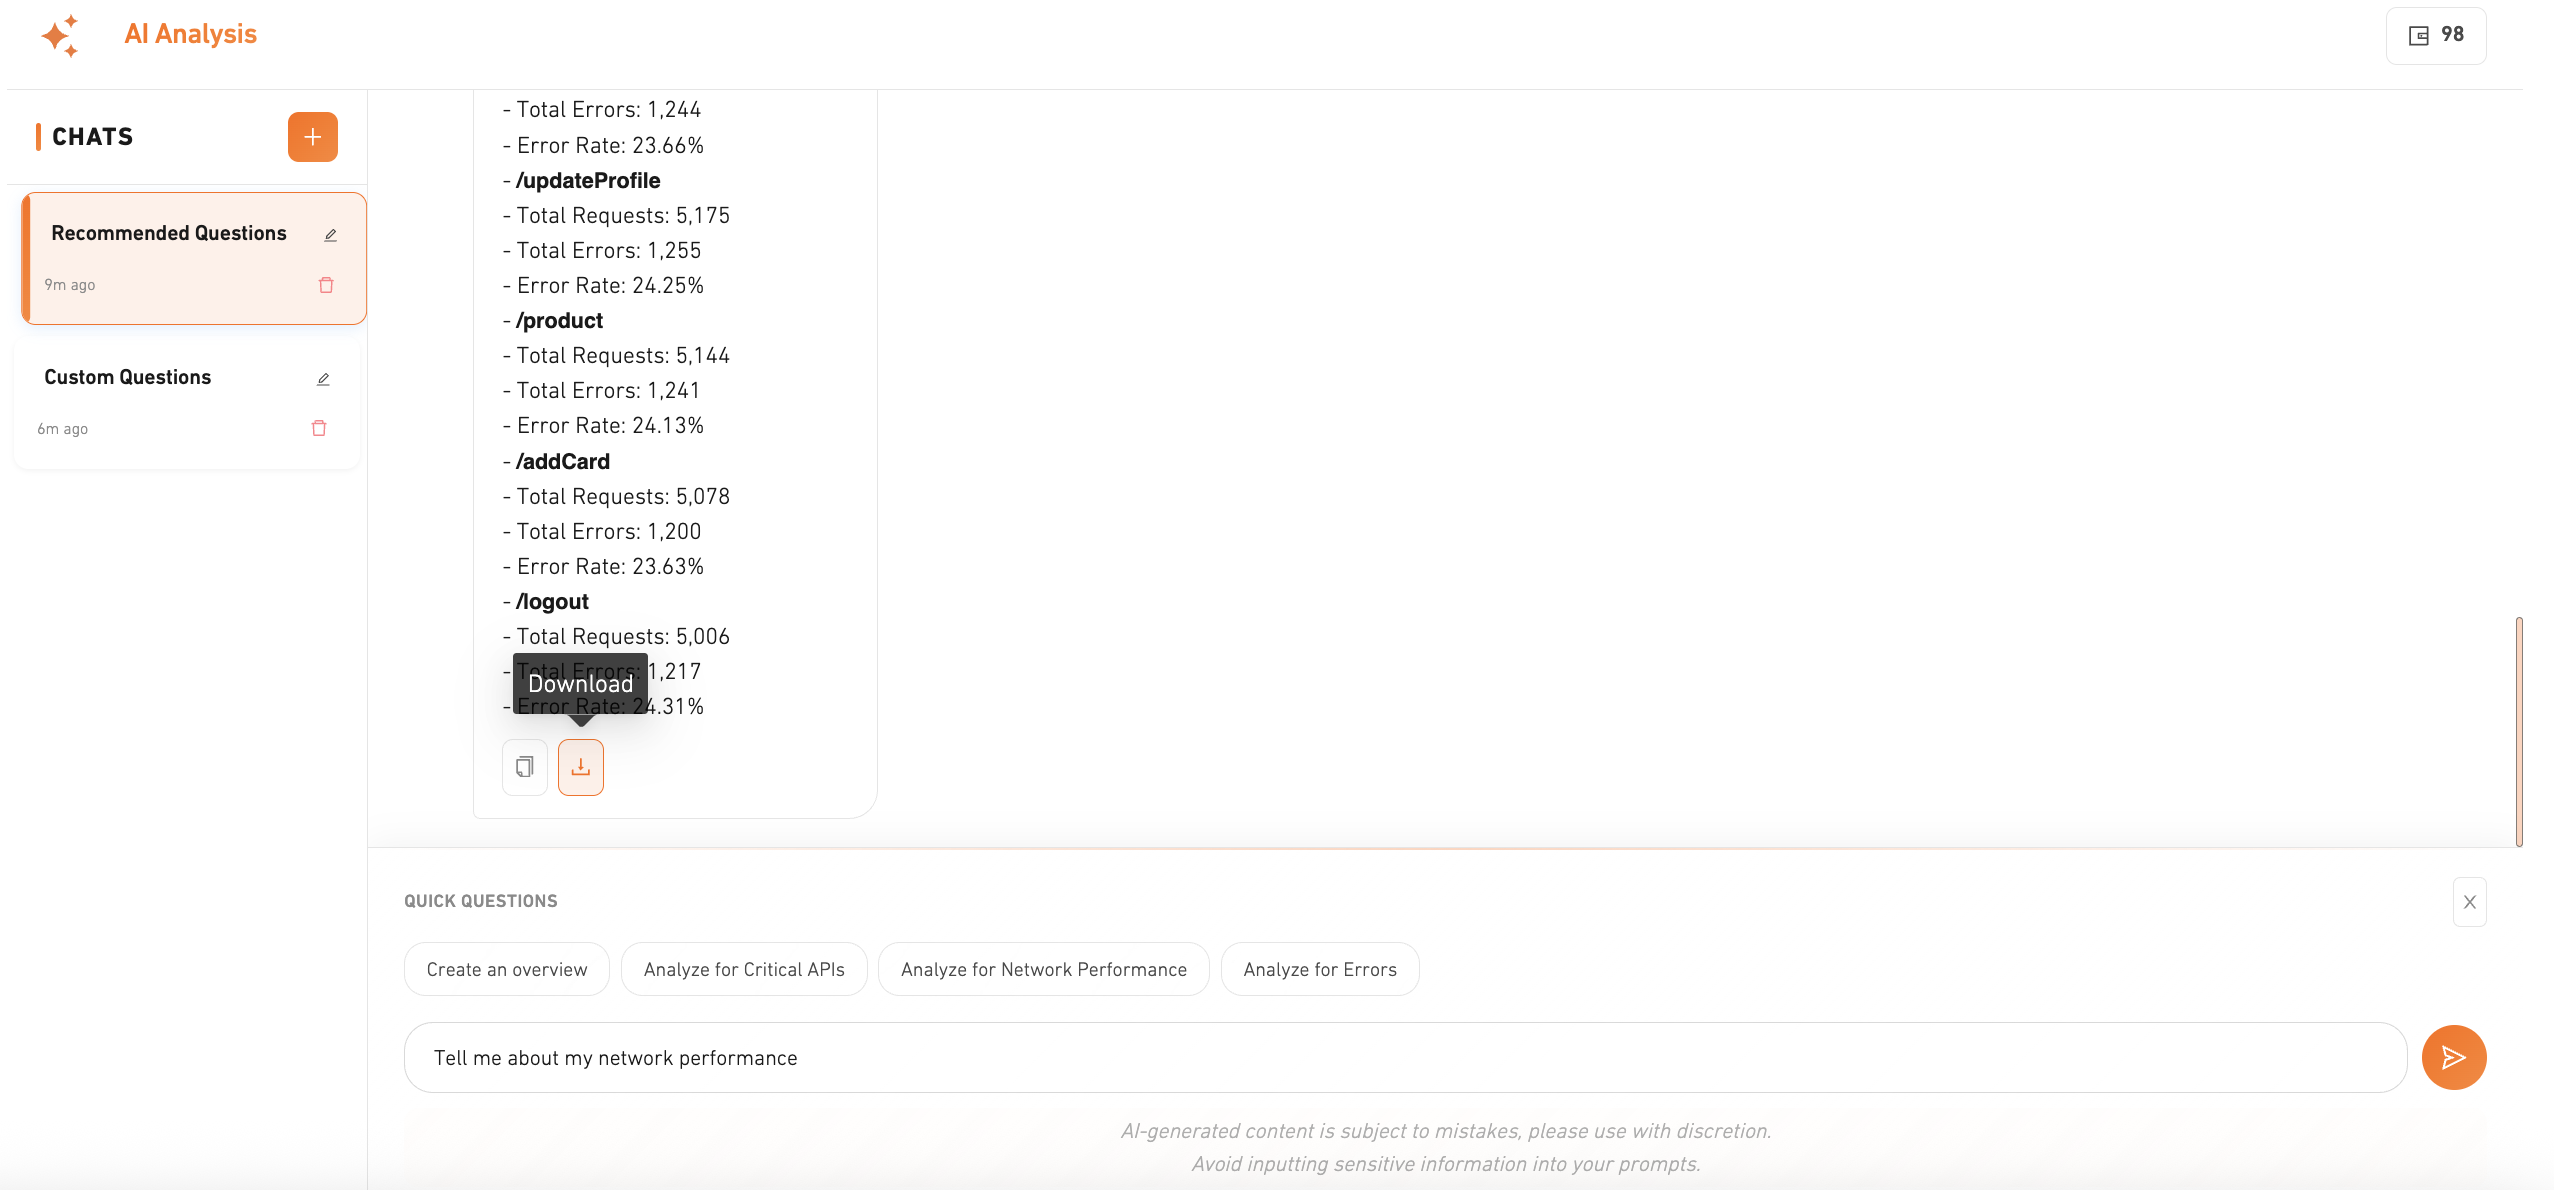
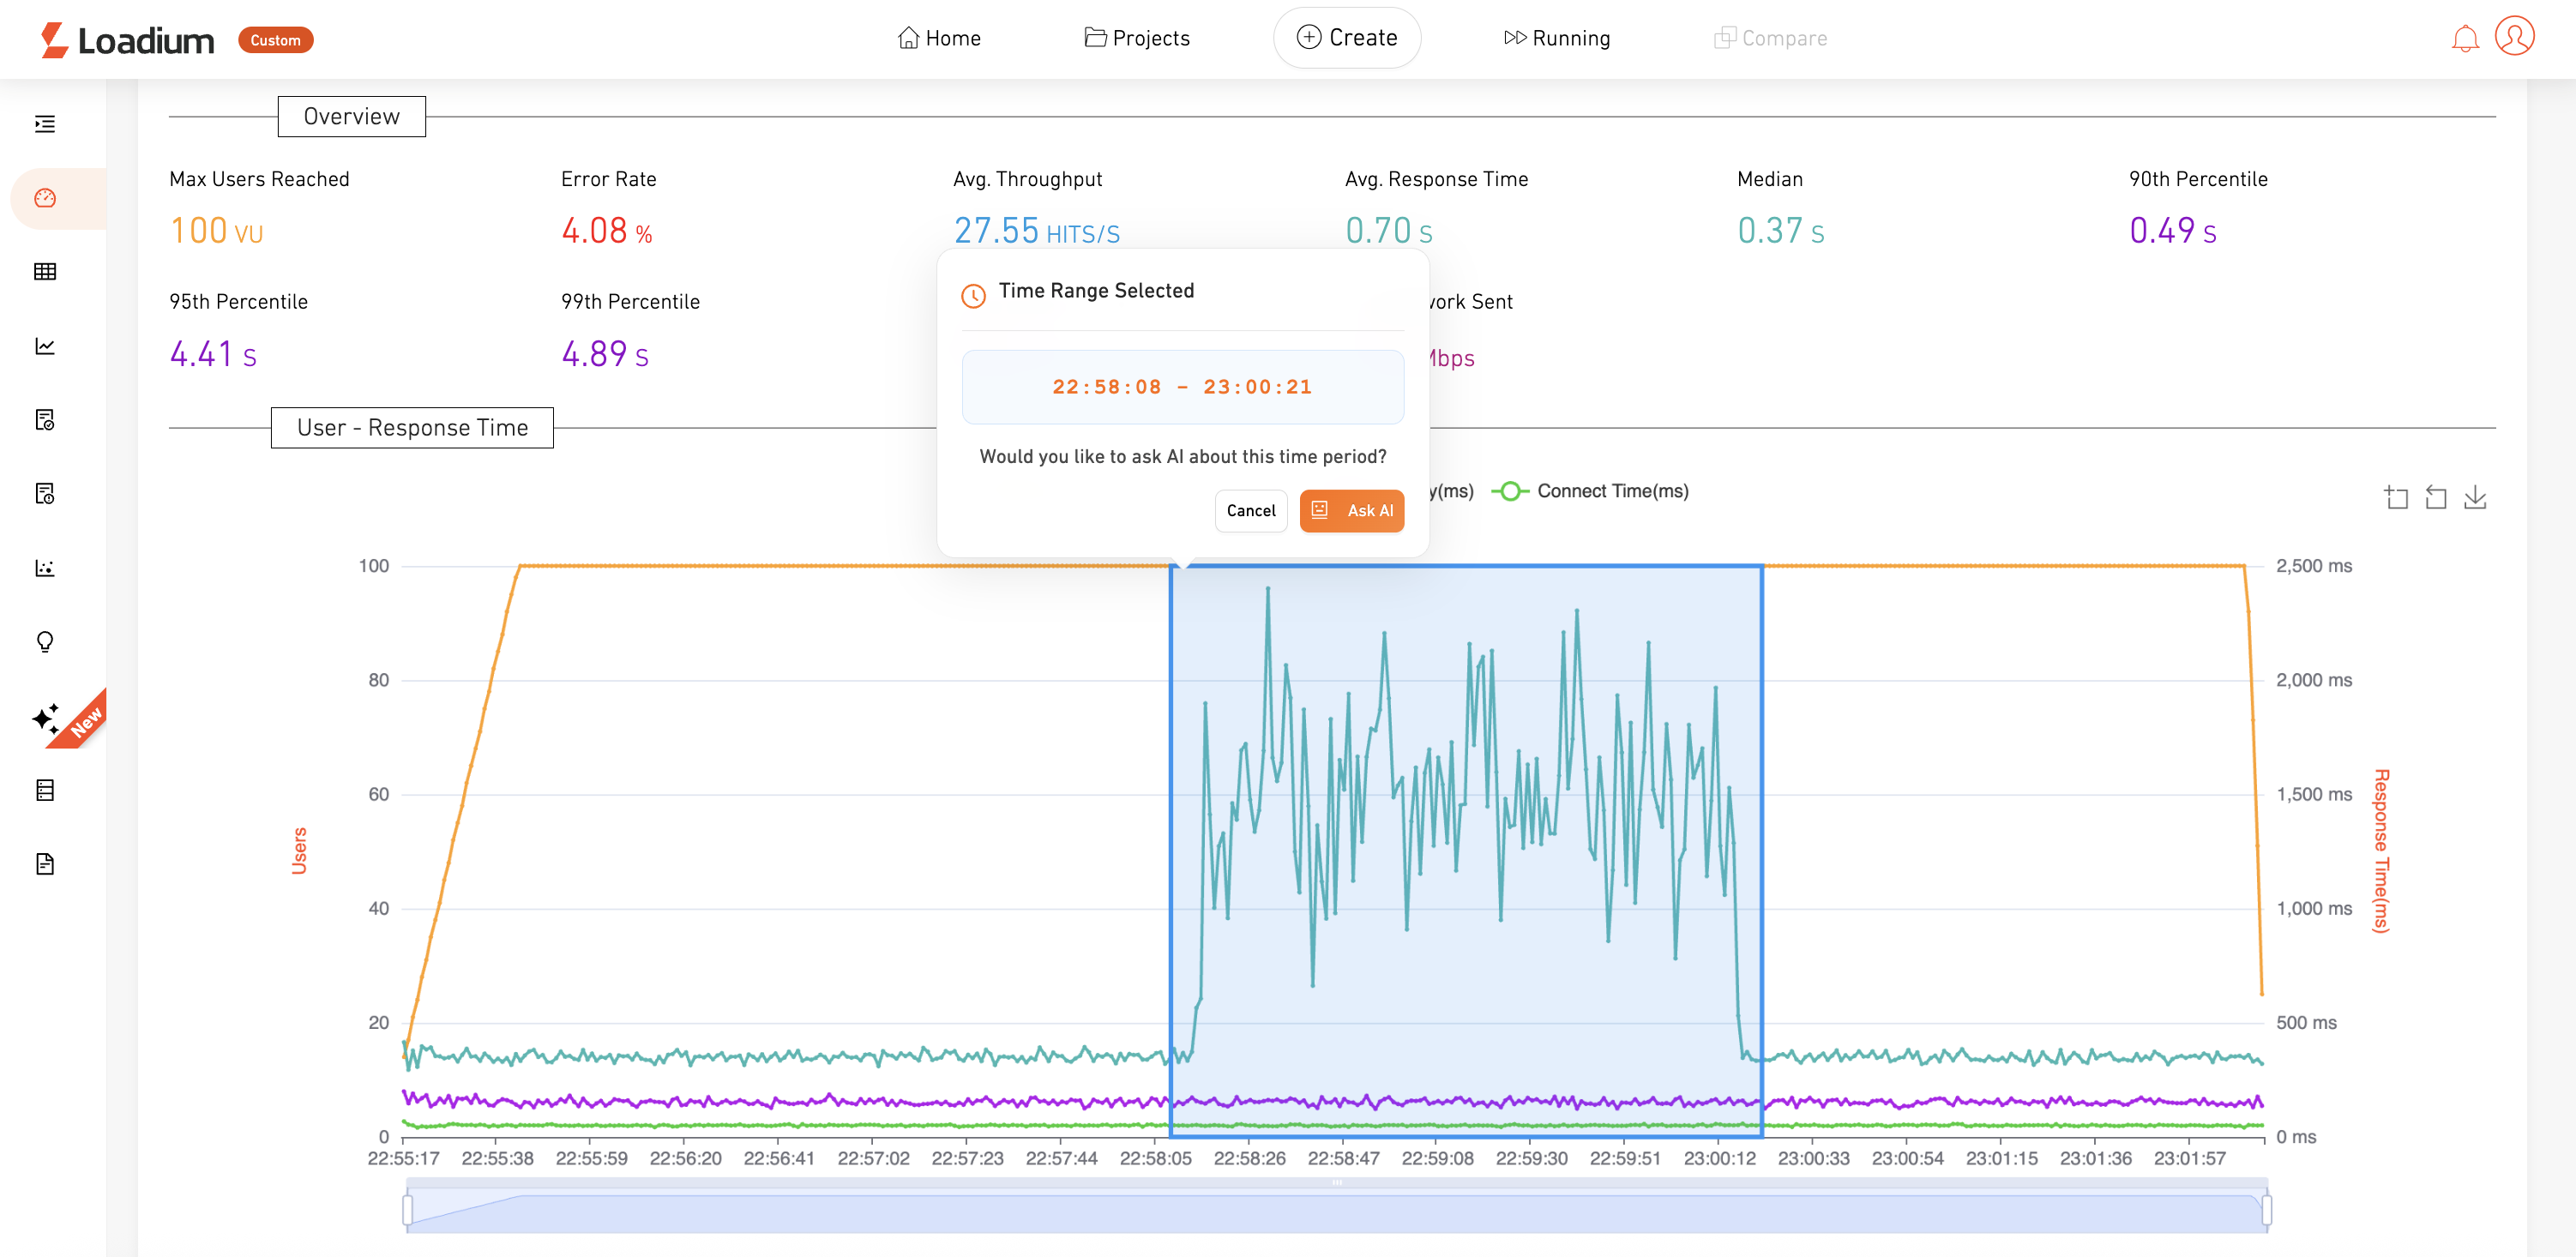
You’ll see an **AI Analysis** section on the report page. In this section, you can interact with the AI by asking questions to get deeper insights into your test results.

You can either:

* Use **Recommended Questions** provided by Loadium for quick analysis
* Ask your own **Custom Questions** to explore specific areas of interest

{% hint style="success" %}
**It’s included in the paid plans.**

**You can ask 5 questions on 5 different reports, total of 25 questions.**
{% endhint %}

***

## Benefits

* **Easy to Understand:** Get simplified summaries and explanations without digging into every graph.
* **Saves Time:** No need to manually review every metric or chart.
* **Deep Diving:** Allows users to catch critical information that could be overlooked during manual review.

***

## Use Cases

* Quickly triaging performance issues during high-load testing
* Preparing for peak events like Black Friday or product launches
* Validating performance improvements after code or infrastructure changes

***

## Tips for Best Results

* Use **Recommended Questions** for the most accurate and optimized insights.
* Avoid including sensitive or private information in your custom questions.
* Combine AI insights with manual review for a comprehensive understanding.

***

If you have any feedback or need help understanding AI results, reach out to our support team — we’re here to help!


# Features

<div align="left"><img src="/files/-MUi08MsH6iilcOBR7fE" alt=""></div>

&#x20;Loadium is fully compatible with JMeter and it’s 3rd party plugins. Test any protocol you want. Set any performance metrics in your requests.

<figure><img src="/files/q7ZPuvTsN2TSgpd4dyfG" alt=""><figcaption></figcaption></figure>

<div align="left"><img src="/files/-MUi0nG4jp3m6E1K81g5" alt=""></div>

Gatling helps you anticipate slow response times and errors early in your development cycle.

![](/files/-MUi0sA9oe040J2kKrvX)

<div align="left"><img src="/files/-MUi0wFx6PlLEnYr_K9y" alt=""></div>

Easily integrate Selenium WebDriver scripts via JMeter’s plugins and include functional test scenarios in performance testing.

<figure><img src="/files/jdCL2B4xVYYbSZyFs8a4" alt=""><figcaption></figcaption></figure>

> ### Are you using Postman for Web API Testing?
>
> Do you want to perform a load test on them? Let’s try our Postman to JMeter Converter. The only thing you have to do is to upload your Postman Collection to Loadium.
>
> [**TRY NOW**](https://loadium.com/postman-to-jmeter-converter/)

<div align="left"><img src="/files/-MUi2N_bu6MhUNrHaTxo" alt=""></div>

### Multi Geo Support

Model your load type from different geo locations by using our Amazon AWS support.

<figure><img src="/files/ouwesKppBu4QNo57Jkjk" alt=""><figcaption></figcaption></figure>

### Network Simulation

Eliminate unexpected network failures and run various bandwidth combinations.

<figure><img src="/files/7zE9aEgk8z7O9qe5NPWc" alt=""><figcaption></figcaption></figure>

**Monitor your app performance by;**&#x20;

APM tools such as New Relic, App Dynamics Detect and diagnose complex application performance problems to maintain hardware level KPI’s.

### Continuous Integration

Use your favorite Continuous Integration server (Jenkins, Teamcity) with Loadium.

Run your JMeter tests in parallel on Loadium’s cloud engines to ensure quality. Integrate your performance test into your delivery pipeline to make sure you deploy most stable build. Set your KPIs and fail the test according to them. Use Jenkins and TeamCity immediately by downloading from plugin markets or use our public APIs for custom integrations. Find the details information about our public APIs in our wiki page.

### **Selenium WebDriver**

* Convert a Selenium WebDriver test into a performance test.
* Write a Selenium script with Java or JavaScript.
* Run your test in Loadium and gather browser level response times.

### **HTTP Test**

* Test your APIs and HTTP URL by using Loadium’s Web UI.
* Simulate GET, POST, PUT and DELETE requests with necessary headers and body.
* No JMeter knowledge required.

### **Test Comparison**

* Export test results into PDF or Excel.
* Choose Simple or Advanced Comparison.
* Monitor how your application performs along the way.

Enjoy load testing!

{% content-ref url="/pages/MgN0OAuKVZtI6DuNx1bd" %}
[Pricing](/about-loadium/pricing)
{% endcontent-ref %}

{% content-ref url="/pages/-MUT64e7K16MOCUe5UD3" %}
[VUH - Virtual User Hour](/about-loadium/vuh-virtual-user-hour)
{% endcontent-ref %}

{% content-ref url="/pages/-MUSAunBwe2J09CIl1hu" %}
[JMeter Test](/create-test/jmeter-test)
{% endcontent-ref %}

{% content-ref url="/pages/7s0YgIf65n80jnrkt05F" %}
[Report PDF Export](/features/report-pdf-export)
{% endcontent-ref %}

If you don't see the answer to your question here, please [reach out to us](https://loadium.com/contact-us/) to let us know! We're always improving our documentation.


# Pricing OLD

How much does it cost? An explanation of Loadium's pricing and billing system

### What is the cost of running test on Loadium?

Loadium has two different types of plans that you can select from: Subscription Packages and Customized Solutions.

### What is a Subscription Package?

A subscription package defines your thread, execution, minutes, and engine limits in the month/year you subscribed. Packages consist of following parameters:

* Thread is corresponding to a virtual user.
* Engine is how many servers run your test.
* Duration is how long your test takes in minutes.

[The packages Loadium offers 2 paid plans:](https://loadium.com/pricing)

#### **Free Package**

You can benefit from Loadium free package to try load testing! You get up to 10 performance tests per month, up to 10 minutes and with 50 users per engine and 1 engine. You can also make 100.000 API call.

In the Free Package, tests are run in shared servers. Therefore, the results can be less reliable and the person who runs the test each location of the load generators provided by Loadium except Dublin.

#### **Starter Package**

[Loadium has two types of Starter Pricing Plans: Annual and Monthly.](https://loadium.com/pricing/)

* Annual Starter Package: There are 300 performance tests that you can use all up either in your first month or spread them out whole year. You can run your tests with 2 engines including 500 virtual users and 2 parallel tests. You can also run unlimited number of GUI functional tests in the test duration you have.&#x20;
* Monthly Starter Package: There are 25 performance tests that renew each month and if they aren’t used within a month, they do not roll over to next month. You can run your tests with 2 engines including 500 virtual users and 2 parallel tests. You can also run unlimited number of GUI functional tests in the test duration you have.

#### **Basic Package**

[Loadium has two types of Basic Pricing Plans: Annual and Monthly.](https://loadium.com/pricing/)

* Annual Basic Package: There are 300 performance tests that you can use all up either in your first month or spread them out whole year. You can run your tests with 4 engines including 2.000 virtual users and 3 parallel tests. You can also run unlimited number of GUI functional tests in the test duration you have.&#x20;
* Monthly Basic Package: There are 25 performance tests that renew each month and if they aren’t used within a month, they do not roll over to next month. You can run your tests with 4 engines including 2.000 virtual users and 3 parallel tests. You can also run unlimited number of GUI functional tests in the test duration you have.

#### **Pro Package**

[Loadium has two types of Pro Pricing Plans: Annual and Monthly.](https://loadium.com/pricing/)

* Annual Pro Package: There are 300 performance tests that you can use all up either in your first month or spread them out whole year. You can run your tests with 10 engines including 5000 virtual users. You can also run unlimited number of GUI functional tests in the test duration you have.
* Monthly Pro Package: There are 25 performance tests that renew each month and if they aren't used within a month, they do not roll over to next month. You can run your tests with 10 engines including 5000 virtual users. You can also run unlimited number of GUI functional tests in the test duration you have.

**Customized Package:** If Basic and Pro packages do not meet your needs, as Loadium we offer a package tailored to your needs. [You may reach Customized Pack details here](https://loadium.com/vuh/)

{% content-ref url="/pages/-MUT64e7K16MOCUe5UD3" %}
[VUH - Virtual User Hour](/about-loadium/vuh-virtual-user-hour)
{% endcontent-ref %}

### How many virtual users do you need to simulate in your tests?

[Load testing ](https://loadium.com/)is not just for peak seasons in your business. It is necessary for all time when you have active users.

During the pandemic, we all recognized that unexpected situations may occur and the businesses (ecommerce, carriers, telecommunication, finance...etc) which were ready for unexpected high traffic, adapted to the changing circumstances easily and quickly.

To determine how many virtual users you need, you should take your highest traffic as basis and add an additional %10 traffic to that level, to stay in the safe zone.

### How often do you need to run load testing?

This depends on the industry you are in and its peak seasons. As [Loadium,](https://loadium.com/features/) we suggest running a load test after each deployment.

### What is Sandbox?

You can run a test without charging your package to be sure your test is running. When you check the SandBox option, the parameters set are as following:

* Engine Count: 1
* Users Per Engine: 5
* Ramp Up Time: 30sec
* Iteration: ∞
* Duration: 1min

{% content-ref url="/pages/-MUSDT9m95VYzdFJ536o" %}
[Sandbox](/test-settings/what-is-sandbox)
{% endcontent-ref %}

Enjoy load testing!


# Pricing

How much does it cost? An explanation of Loadium's pricing and billing system

### What is the cost of running test on Loadium?

Loadium has two different types of plans that you can select from: Subscription Packages and Customized Solutions.

### What is a Subscription Package?

A subscription package defines your thread, execution, minutes, and engine limits in the month/year you subscribed. Packages consist of following parameters:

* Thread is corresponding to a virtual user.
* Engine is how many servers run your test.
* Duration is how long your test takes in minutes.

[The packages Loadium offers 2 paid plans:](https://loadium.com/pricing)

#### **Free Package**

You can benefit from Loadium free package to try load testing! You get up to 10 performance tests per month, up to 5 minutes and with 100 users per engine and 1 engine. You can also make 200.000 API call.

In the Free Package, tests are run in shared servers. Therefore, the results can be less reliable and the person who runs the test each location of the load generators provided by Loadium except Dublin.

#### **Starter Package**

[Loadium has two types of Starter Pricing Plans: Annual and Monthly.](https://loadium.com/pricing/)

* Annual Starter Package: There are 300 performance tests that you can use all up either in your first month or spread them out whole year. You can run your tests with 2 engines including 500 virtual users and 2 parallel tests. You can also run unlimited number of GUI functional tests in the test duration you have.&#x20;
* Monthly Starter Package: There are 25 performance tests that renew each month and if they aren’t used within a month, they do not roll over to next month. You can run your tests with 2 engines including 500 virtual users and 2 parallel tests. You can also run unlimited number of GUI functional tests in the test duration you have.

#### **Basic Package**

[Loadium has two types of Basic Pricing Plans: Annual and Monthly.](https://loadium.com/pricing/)

* Annual Basic Package: There are 300 performance tests that you can use all up either in your first month or spread them out whole year. You can run your tests with 4 engines including 2.000 virtual users and 3 parallel tests. You can also run unlimited number of GUI functional tests in the test duration you have.&#x20;
* Monthly Basic Package: There are 25 performance tests that renew each month and if they aren’t used within a month, they do not roll over to next month. You can run your tests with 4 engines including 2.000 virtual users and 3 parallel tests. You can also run unlimited number of GUI functional tests in the test duration you have.

#### **Pro Package**

[Loadium has two types of Pro Pricing Plans: Annual and Monthly.](https://loadium.com/pricing/)

* Annual Pro Package: There are 300 performance tests that you can use all up either in your first month or spread them out whole year. You can run your tests with 10 engines including 5000 virtual users. You can also run unlimited number of GUI functional tests in the test duration you have.
* Monthly Pro Package: There are 25 performance tests that renew each month and if they aren't used within a month, they do not roll over to next month. You can run your tests with 10 engines including 5000 virtual users. You can also run unlimited number of GUI functional tests in the test duration you have.

**Customized Package:** If Basic and Pro packages do not meet your needs, as Loadium we offer a package tailored to your needs. [You may reach Customized Pack details here](https://loadium.com/vuh/)

{% content-ref url="/pages/-MUT64e7K16MOCUe5UD3" %}
[VUH - Virtual User Hour](/about-loadium/vuh-virtual-user-hour)
{% endcontent-ref %}

### How many virtual users do you need to simulate in your tests?

[Load testing ](https://loadium.com/)is not just for peak seasons in your business. It is necessary for all time when you have active users.

During the pandemic, we all recognized that unexpected situations may occur and the businesses (ecommerce, carriers, telecommunication, finance...etc) which were ready for unexpected high traffic, adapted to the changing circumstances easily and quickly.

To determine how many virtual users you need, you should take your highest traffic as basis and add an additional %10 traffic to that level, to stay in the safe zone.

### How often do you need to run load testing?

This depends on the industry you are in and its peak seasons. As [Loadium,](https://loadium.com/features/) we suggest running a load test after each deployment.

### What is Debug Test?

You can run a test without charging your package to be sure your test is running. When you click on the Debug Test button, the parameters set are as following:

<figure><img src="/files/6a2enFoHt7RXfG9sHZbA" alt=""><figcaption></figcaption></figure>

* Engine Count: 1
* Users Per Engine: 5
* Ramp Up Time: 30sec
* Iteration: ∞
* Duration: 1min

{% content-ref url="/pages/wI8l9qDIU45UK8k96hZO" %}
[Debug Test](/test-settings/debug-test)
{% endcontent-ref %}

Enjoy load testing!


# VUH - Virtual User Hour

## What is VUH?

Virtual User Hour (VUH) is a credit system for running load tests.&#x20;

‘VUH’ plans will use VUH as test credits, instead of test counts.

‘VUH’ plans offer greater flexibility than ‘Test Count’ plans. Their flexible consumption model—where you pay only for what you use—provides additional advantages compared to ‘Test Count’ plans.

1 VUH corresponds to 1 virtual user running test for 1 hour.

{% hint style="info" %}
*1.000 virtual users running test for 1 hour would result in 1.000 VUH usage*
{% endhint %}

Loadium calculates VUH consumption by rounding up to 30-minute intervals, rather than a full hour, to provide better cost flexibility.

{% hint style="info" %}
*For example, a test with 1.000 virtual users running for 15 minutes (ceiled to 30 minutes) would result in 500 VUH usage (instead of 1.000 VUH).*
{% endhint %}

## How to Calculate VUH?

* Tests between 0–30 minutes will consume VUH at a 0.5x rate.
* Tests between 30–60 minutes will consume VUH at a 1x rate.
* Beyond 60 minutes, usage will continue in 30-minute increments at an additional 0.5x each block.

You may calculate the VUH with the formula below:

<figure><img src="/files/8enRUlNz1MMJXfYKQSlE" alt="" width="375"><figcaption></figcaption></figure>

## How do I determine how much VUH I need?

Below are a few steps and considerations that can help you estimate how much Virtual User Hour (VUH) capacity you’ll need:

1. **Identify Test Goals and Parameters**
   1. Determine the purpose and scale of your load test. Are you testing peak traffic scenarios, or trying to validate performance under normal load?
   2. Pin down the number of virtual users (VUs) you want to run and the test duration (minutes or hours per test).
2. **Use Historical or Similar Test Data**
   1. If you’ve performed load tests before, review those metrics. How many virtual users did you employ? How long did each test last?
   2. If you’re unsure, look at your website or application’s typical traffic patterns and consider a safety margin for unexpected spikes.
3. **Factor in Test Frequency**
   1. Plan for how often you’ll run these tests—monthly, weekly, or daily. Frequent, smaller tests might allow for better control.
4. **Leave Room for Adjustments**
   1. You may want to allow extra VUH for retests or extended durations if you need to tweak parameters or confirm results.
   2. Having a bit of buffer capacity can save time and ensure you don’t run out of VUH mid-test.

{% hint style="info" %}
**Example for 10,000 VUH Usage:**

* Test Series A:
  * 500 Users for 30 min, 6 runs
  * VUH per run: 250
  * Total: 1,500 VUH
* Test Series B
  * 1,000 Users for 60 min, 3 runs
  * VUH per run: 1,000
  * Total: 3,000 VUH
* Test Series C
  * 2,000 Users for 30 min, 3 runs
  * VUH per run: 1,000
  * Total: 3,000 VUH
* Test Series D
  * 5,000 Users for 30 min, 1 run
  * VUH per run: 2,500
  * Total: 2,500 VUH

#### **Grand Total VUH**

1,500 + 3,000 + 3,000 + 2,500 = **10,000 VUH**
{% endhint %}

## When will you charge my usage from my account?

Before running a load test, you can see how many VUH will be charged from your account under the test parameters slider. When you run the test, the usage will be charged.

We have a prepaid option for VUH. After purchasing VUH, you can see the number of VUH in your account and run your performance tests.

## Will I exceed my package limit?

Since we have a prepaid option, you can’t exceed your limit in your package.


# Profile & Account old ui

What is , How to Use & Things to Pay Attention

If you click the account button in the dropdown menu that opens after clicking your name to see your  profile information, you will come to the account page.  &#x20;

![](/files/-Ma926kGENG7GI-nkvIz)

## Account Overview

There are five tabs under the 'Overview' when you navigate to your account information page.

* Basic Usage Information
* Usage Information Chart
* User Information
* Billing Address
* Change Password

### Basic Usage Information

In this page, you are able to see your Loadium usage.

* Total test or vuh count
* Executed test or vuh count
* Remaining test or vuh count

can be found on that page.

![](/files/PnXgjYjDT5SPixJDHHgX)

###

&#x20;

### **User Information**

You can see your user information in this area.   <br>

![](/files/-MaCVj9PHB6_9QN78Vb8)

### **Billing Address**

You can see your address information in this area.  <br>

<figure><img src="/files/6IXPvPslQclfhOKDwKTC" alt=""><figcaption></figcaption></figure>

Enjoy Load testing!


# Profile & Account

What is , How to Use & Things to Pay Attention

When you click the profile icon in the upper-left corner of the screen, a dropdown menu will appear. By selecting the **Account** option from this menu, you will be directed to the Account page where you can view and manage your profile information.

<figure><img src="/files/bL7NBzWay58hZCBzKz4L" alt=""><figcaption></figcaption></figure>

The **Account** page allows you to manage your personal information, company details, security settings, and preferences within Loadium. Each section below helps you maintain full control over your profile and ensures a secure and personalized testing experience.

### **User Information**

<figure><img src="/files/MLe50ksmzrZsAHuQEAck" alt=""><figcaption></figcaption></figure>

This section contains your basic personal information associated with your Loadium account.

* View or update your full name and email address
* Manage communication preferences
* Ensure your account details stay accurate and up to date
* Provides your Access Key required to create Private Location load generators.

***

### **Company**

<figure><img src="/files/wr0ZI0Cpqa0lqZxn8F5P" alt=""><figcaption></figcaption></figure>

Here you can manage your organization-related information.

* Add or edit your company name
* Provide optional organizational details for invoicing or compliance
* Helps align your Loadium account with your business identity

***

### **Billing Address**

<figure><img src="/files/qkPZ2Eit4BINw37qO5Pr" alt=""><figcaption></figcaption></figure>

Your billing address is used for invoices and subscription-related documentation.

* Enter or update billing address details
* Ensure your invoices reflect correct company and tax information
* Required for paid subscription plans

***

### **Change Password**

<figure><img src="/files/qmnlvpcobzZprfXSUCjU" alt=""><figcaption></figcaption></figure>

Maintain the security of your account by changing your password at any time.

* Update your current password
* Recommended regularly for enhanced account protection
* Supports strong password policies

***

### **Account Time Zone**

<figure><img src="/files/7j9PxAeM8ZuayVXZoJBH" alt=""><figcaption></figcaption></figure>

Configure the time zone used across your Loadium account.

* Test schedules, reports, and timestamps are displayed in your chosen time zone
* Ensures consistent tracking across global teams
* Useful for accurate scheduling and reporting

***

### **Public Report Access**

Manage whether your test reports can be accessed via public links.

* Enable or disable external visibility
* Share reports easily with stakeholders when needed
* Control report access without requiring account login

***

### **Two-Factor Authentication (2FA)**

Improve your account security with an additional authentication step.

* Enable Two-Factor Authentication for stronger protection
* Prevent unauthorized access to your account
* Recommended for all enterprise users

***

### **Account Settings**

Provides the option to permanently delete your Loadium account and remove all associated data.


# Subscription OLD

Details of the subscription system in Loadium

Subscription system allows [Loadium](https://loadium.com/) users to get continuous flow of benefits from its services, without interruption, and suit better to users' tight schedule for performance testing.

Since performance testing can be considered to have a seasonal fluctuation, [Loadium](https://loadium.com/pricing) has very flexible subscription management to address to this situation.

## **Subscription Types**

Loadium provides **2 types of subscription plan** which are identified as **Test Counts** or **Virtual User Hour (VUH)**.

**Test Count** type plans have Annual and Monthly subscriptions available. Test usages are identified as test counts, meaning that each test run will use 1 test count. Engine count is limited in these plans.

![Example Test Count Plan](/files/3orxxns51RethOp2YV89)

**VUH** plan is more flexible option and available as Monthly subscription. Test usages are identified as VUH units, meaning that each test capacity will be using corresponding amount of VUH. Engine count is extensive and broad in these plans, you can contact to support to let us meet your needs.

![Example Virtual User Hour (VUH) Plan](/files/fZuVlUTWPUAPEXaCypLS)

In Monthly and Annual Subscription Plans, payment is completed at the start of the period, and the plan can be used it until the end of period. After your period ends, your subscription is renewed automatically until cancelled (remaining test usages are not transferred to next cycle).

## Re-Charging / Changing Plan

If your current plan is out of test usages you can re-purchase your plan to re-charge your test usages, or if your current plan doesn't meet your need anymore you change it by purchasing a different plan

When you complete a new payment for a plan, your billing cycle will be updated, starting from the new purchase date. Test usages from previous plan will not be transferred to the new plan

## Canceling Subscription

After canceling your subscription, it will not renew automatically. You can still keep using Loadium with your current plan and test usages, until the expiration date.

When your subscription is cancelled, price discounts and all other advantages from coupons and similar services will not be applied to your next purchase.

You should follow the steps below, to cancel your subscription.

1. Login your Loadium account, and go to the "Account" tab, that you can find at the right top of the page.

![](/files/zRB23l3udr7ROFNQiS0x)

2\. Go to the "Subscription" section under your account, and click to the "Cancel Subscription" button under the "Plan" tab, at the right bottom.

![](/files/QsPEX6lelxAFDQm892pG)

Once you cancel your subscription, you will not be charged till purchasing another plan. After cancellation and starting Free Plan, you will lose following features supported by paid plan :

* Data retention,
* Dedicated IP(s) in use,
* Coupons in use,
* 24/7 Support.

## Unsuccessful Renewal Payment

If the payment is unsuccessful to renew your subscription, it will be re-tried for 3 more times within 3 days. After a successful payment, your package contents will be refreshed automatically. You can also add a new card to make the transaction.

After 3 days unsuccessful payment, your subscription will be cancelled, and price discounts and other advantages from coupons and similar services will be discontinued.

After this cancellation, your account will be automatically downgraded to the free plan. You can check all plan details [here.](https://loadium.com/pricing)

## Managing Credit Cards

During your first package purchase, credit-card you enter will be saved to your Loadium account, and will be set to "default card" automatically for further transactions. Cards that are tagged as "default" cannot be removed from the account.

You can add new cards to your account and change your default card. If you have any questions, you can [contact our support team](https://loadium.com/contact-us).


# Subscription

Details of the subscription system in Loadium

Subscription system allows [Loadium](https://loadium.com/) users to get continuous flow of benefits from its services, without interruption, and suit better to users' tight schedule for performance testing.

Since performance testing can be considered to have a seasonal fluctuation, [Loadium](https://loadium.com/pricing) has very flexible subscription management to address to this situation.

## **Subscription Types**

Loadium provides **2 types of subscription plan** which are identified as **Test Counts** or **Custom/Virtual User Hour (VUH)**.

**Test Count** type plans have Annual and Monthly subscriptions available. Test usages are identified as test counts, meaning that each test run will use 1 test count. Engine count is limited in these plans.

<figure><img src="/files/sAYW5JsWyTNWAXPyRVRb" alt=""><figcaption><p>Example of Test Count Plan</p></figcaption></figure>

**Custom (VUH)** plan is more flexible option and available as Monthly subscription. Test usages are identified as VUH units, meaning that each test capacity will be using corresponding amount of VUH. Engine count is extensive and broad in these plans, you can contact to support to let us meet your needs.

<figure><img src="/files/msBCiuwPfMoSh061Xlv0" alt=""><figcaption><p>Example of Virtual User Hour (VUH) Plan</p></figcaption></figure>

In Monthly and Annual Subscription Plans, payment is completed at the start of the period, and the plan can be used it until the end of period. After your period ends, your subscription is renewed automatically until cancelled (remaining test usages are not transferred to next cycle).

## Re-Charging / Changing Plan

If your current plan is out of test usages you can re-purchase your plan to re-charge your test usages, or if your current plan doesn't meet your need anymore you change it by purchasing a different plan

When you complete a new payment for a plan, your billing cycle will be updated, starting from the new purchase date. Test usages from previous plan will not be transferred to the new plan

## Unsuccessful Renewal Payment

If the payment is unsuccessful to renew your subscription, it will be re-tried for 3 more times within 3 days. After a successful payment, your package contents will be refreshed automatically. You can also add a new card to make the transaction.

After 3 days unsuccessful payment, your subscription will be cancelled, and price discounts and other advantages from coupons and similar services will be discontinued.

After this cancellation, your account will be automatically downgraded to the free plan. You can check all plan details [here.](https://loadium.com/pricing)

## Managing Credit Cards

During your first package purchase, credit-card you enter will be saved to your Loadium account, and will be set to "default card" automatically for further transactions. Cards that are tagged as "default" cannot be removed from the account.

You can add new cards to your account and change your default card. If you have any questions, you can [contact our support team](https://loadium.com/contact-us).


# Audit Log

## Overview

The Audit Log records and displays a chronological sequence of authentication-related actions taken by users. It serves as a reliable source of truth for:

* Monitoring account activity
* Troubleshooting suspicious behavior
* Supporting compliance audits
* Enhancing user accountability

You can access the Audit Log from the **Account > Audit Log** section.

Each log entry includes:

* **Email address**
* **Action**
* **Category**
* **IP address**
* **Date**
* **Time** (timezone depends on your account settings)

***

## Logged Actions

All authentication-related actions currently captured in Loadium’s Audit Log are listed below:

| `user register`                   | A new user account was created                                          |
| --------------------------------- | ----------------------------------------------------------------------- |
| `user activation`                 | The user's account was activated                                        |
| `user email activation`           | The user re-sent the activation email                                   |
| `user change-password`            | The user changed their account password                                 |
| `user forgot-password`            | A password reset request was initiated by the user                      |
| `user-update`                     | The user updated their account details (e.g., name, email, preferences) |
| `login`                           | The user successfully logged into the platform                          |
| `logout`                          | The user logged out from the platform                                   |
| `sub-users invitation create`     | An admin created a new sub-user invitation                              |
| `resend Invited User Mail`        | A sub-user invitation email was re-sent                                 |
| `delete Invited User`             | A pending invited sub-user was deleted before activation                |
| `sub-users invitation activation` | A sub-user accepted their invitation and activated their account        |
| `sub-user register`               | A new sub-user account was registered                                   |
| `sub-user update`                 | A sub-user's details or permissions were updated                        |
| `sub-user-delete`                 | A sub-user account was deleted                                          |
| `google login`                    | The user logged in using Google authentication                          |
| `microsoft login`                 | The user logged in using Microsoft authentication                       |
| `sub-user microsoft login`        | A sub-user logged in using Microsoft authentication                     |
| `amazon register`                 | Amazon login integration was initiated                                  |
| `amazon activation`               | Amazon login integration was successfully completed                     |
| `amazon user info`                | User details were retrieved from Amazon during authentication           |
| `company delete`                  | A company account was deleted from the platform                         |

***

### **Use Cases**

* **Security Review:** Quickly identify failed login attempts or access from unusual IPs.
* **Compliance Audits:** Demonstrate access control measures to meet regulatory requirements (e.g., ISO 27001).
* **Incident Response:** Trace suspicious user behavior to determine potential compromise or misuse.

***

### **Retention Policy**

Audit logs are stored securely and retained for **90 days**. Extended retention options may be available for enterprise customers.

***

### **Export & Filtering**

* **Filter Options:** By date range
* **Export:** Audit logs can be exported as CSV for internal reporting or compliance use


# Test Report

A guide for Test Report Page will be coming soon!


# AI Analysis

**Loadium AI Alanysis** is an intelligent performance insight tool that allows you to utilize AI to analyze your test results and uncover meaningful insights without manual effort.

***

## What Does It Do?

Loadium AI Analysis helps you:

* Understand your test results faster by summarizing complex data.
* Identify anomalies, slow transactions, and potential bottlenecks.
* Ask natural language questions to get AI-generated insights on specific issues.
* Navigate through your load test data with the help of Recommended or Custom questions.

***

## How It Works

Once your load test is complete, the AI Analysis tab will be visible on your test report screen.

<figure><img src="/files/1TzMZTiMKRAek6ffIvPh" alt=""><figcaption></figcaption></figure>

In this section, you can interact with the AI by asking questions to get deeper insights into your test results.

You can either:

* Use **Quick Questions** provided by Loadium for reliable analysis.

<figure><img src="/files/3n44f20Nmu4Fv9yWqTES" alt=""><figcaption></figcaption></figure>

* Ask your own **Custom Questions** to explore specific areas of interest.

<figure><img src="/files/RAb5771IjRRCbVpJpQEU" alt=""><figcaption></figcaption></figure>

You can copy the results for later use or download them with a single click.

<figure><img src="/files/hT1f0vsCbXDUi4Hnj0wK" alt=""><figcaption></figcaption></figure>

***

## Alternative Usage

Another way to use it is by accessing it directly from the graph. On your report screen, simply select a time range where you notice an anomaly on any chart, and the AI Assistant will help you analyze the selected period using a ready-made prompt.

<figure><img src="/files/iqO1Sqq8i26DcDj15rd2" alt=""><figcaption></figcaption></figure>

***

## Benefits

* **Easy to Understand:** Get simplified summaries and explanations without digging into every graph.
* **Saves Time:** No need to manually review every metric or chart.
* **Deep Diving:** Allows users to catch critical information that could be overlooked during manual review.

***

## Tips for Best Results

* Use **Quick Questions** for the most accurate and optimized insights.
* Avoid including sensitive or private information in your custom questions.
* Combine AI insights with manual review for a comprehensive understanding.


# Compare Test old ui

A guide for using Loadium's test comparing feature.

Running performance tests and analyzing the results is important, but another crucial factor is comparing results between different reports and understanding if there is an improvement from previous runs.

You can access to comparing test page from the top banner. At first you will notice that it is disabled, because there is no tests selected to compare.

![](/files/BPEBf9UnUmBm3q8kqqo7)

## Selecting Tests to Compare

When you enter to one of your tests, you will see the previously run test sessions. Then you can see the checkbox next to each session, and clicking on it will add it to comparing page. After you click on the checkbox, you will notice that Compare Test page has a number showing, and the page is enabled for clicking.

![](/files/DCHoDIDljzn2EXJ5v94d)

{% hint style="info" %}
You can compare **2 tests at the same time**, and if you want to change tests, you need to remove previously selected and then add the new one.
{% endhint %}

## Comparing the Tests

On the first sight of the page, you will be at the **Overview** tab, and you will also notice the **Request List** of the selected tests on the left side.

There are 3 ways to compare metrics of the tests:

* **Overview**
  * Overall data comparison of metrics
* **Stats**
  * Numerical data comparison of requests
* **Graphs**
  * Graphical data comparison of requests

![](/files/6p41FlCsHhgWJTNQBmkO)

### Request List

All of the requests that has data metrics from the test will be listed here. You can use checkboxes to view its data to be shown in **STATS** and **GRAPHS** pages.

![](/files/ePYtmMxOBDxNmKUDLU22)

### Overview Tab

This tab is for viewing and comparing overall metrics of tests rather than specific data from requests. Selecting data from Request List has no effect on this page. All of the metrics shown in this page is sum of all requests.

Sum of all requests data can be seen for each session as table at the top (Total Hits, Total Errors, Average Throughput etc.).

There is also User-ResponseTime graphic available for each session to compare side by side.

![](/files/eDs2ZJfilxksBaR7aq09)

### Stats Tab

You can compare the numerical data of the selected requests on this tab. Choosing a request from request list will add its data to table. The order which you choose will be reflected to table, so you can create your own custom table for both comparing, and also copying data to export to elsewhere.

![](/files/LfRZmJoo34Q3WCQ9lbjy)

### Graphs Tab

You can compare the graphical data of the selected requests on this tab. Choosing a request from request list will add its data to the graph. You can create your own custom graphs on this page and then save it as image.

![](/files/2LzMtmr1BPDdmdCRGdcb)

#### Percentile Graph

Percentile metrics are a measure of response time, which is industrial standart to interpret the performance. **Percentile graph** is a special graph that is only available while comparing, allows you to compare more efficiently between the tests.

![](/files/wTHItN846E74CQ3llZyk)

Happy testing!

If you don't see the answer to your question here, please [reach out to us](https://loadium.com/contact-us/) to let us know! We're always improving our documentation.

{% content-ref url="/pages/-MUSAunBwe2J09CIl1hu" %}
[JMeter Test](/create-test/jmeter-test)
{% endcontent-ref %}

{% content-ref url="/pages/-MUT5hLDUtoTsSYDaFkV" %}
[Pricing OLD](/about-loadium/pricingold)
{% endcontent-ref %}

{% content-ref url="/pages/-MUT64e7K16MOCUe5UD3" %}
[VUH - Virtual User Hour](/about-loadium/vuh-virtual-user-hour)
{% endcontent-ref %}


# Compare Test

A guide for using Loadium's test comparing feature.

Running performance tests and analyzing the results is important, but another crucial factor is comparing results between different reports and understanding if there is an improvement from previous runs.

You can access to comparing test page from the top banner. At first you will notice that it is disabled, because there is no tests selected to compare.

<figure><img src="/files/gzEqZ0Of2goRt0dRDWxD" alt=""><figcaption></figcaption></figure>

## Selecting Tests to Compare

When you enter to one of your tests, you will see the previously run test sessions. Then you can see the Add to Compare button next to each session, and clicking on it will add it to comparing page. After you click on the button, you will notice that Compare Test page has a number showing, and the page is enabled for clicking.

<figure><img src="/files/GcNdaVXmTnaF3rwFS6Ti" alt=""><figcaption></figcaption></figure>

<figure><img src="/files/V7VLf7R6dCLvIXHpIEy5" alt=""><figcaption></figcaption></figure>

{% hint style="warning" %}
You can compare **5 tests at the same time**, and if you want to change tests, you need to remove previously selected and then add the new one.
{% endhint %}

## Comparing the Tests

On the first sight of the page, you will be at the **Overview** tab, and you will also notice the **Request List** of the selected tests on the left side.

There are 3 ways to compare metrics of the tests:

* **Overview**
  * Overall data comparison of metrics
* **Stats**
  * Numerical data comparison of requests
* **Graphs**
  * Graphical data comparison of requests

<figure><img src="/files/VBPIfqCm6s0ft9wYqJQX" alt=""><figcaption></figcaption></figure>

### Request List

All of the requests that has data metrics from the test will be listed here. You can use checkboxes to view its data to be shown in **STATS** and **GRAPHS** pages.,

<div align="center"><figure><img src="/files/3rcik7YJQhNelsyluaHp" alt="" width="375"><figcaption></figcaption></figure></div>

### Overview Tab

This tab is for viewing and comparing overall metrics of tests rather than specific data from requests. Selecting data from Request List has no effect on this page. All of the metrics shown in this page is sum of all requests.

Sum of all requests data can be seen for each session as table at the top (Total Hits, Total Errors, Average Throughput etc.).

<figure><img src="/files/e4vPZViT91jPmj72GVxR" alt=""><figcaption></figcaption></figure>

There is also Composite Graphic which is available for each session to compare KPIs side by side.

<figure><img src="/files/HHkyHHBm8Jj5Pl79JgV6" alt=""><figcaption></figcaption></figure>

### Stats Tab

You can compare the numerical data of the selected requests on this tab. Choosing a request from request list will add its data to table. The order which you choose will be reflected to table, so you can create your own custom table for both comparing, and also copying data to export to elsewhere.

<figure><img src="/files/g78X4uNtqOo1OXV7MrRh" alt=""><figcaption></figcaption></figure>

### Graphs Tab

You can compare the graphical data of the selected requests on this tab. Choosing a request from request list will add its data to the graph. You can create your own custom graphs on this page and then save it as image.

<figure><img src="/files/W3FaXoaMXvUPqUpRTl30" alt=""><figcaption></figcaption></figure>

#### Percentile Graph

Percentile metrics are a measure of response time, which is industrial standart to interpret the performance. **Percentile graph** is a special graph that is only available while comparing, allows you to compare more efficiently between the tests.

<figure><img src="/files/PrA4uhAJEodtmWzYNIzR" alt=""><figcaption></figcaption></figure>

### PDF Export

To save compare test report as a PDF, click the PDF Export button in the upper-left corner of the page.

<figure><img src="/files/qcYhwYEnwk8cKUaHrfZr" alt=""><figcaption></figcaption></figure>

Select the desired data in the popup, then click “Download PDF” to download the report, and the PDF will be automatically generated and saved to your device.

<figure><img src="/files/aO8jHS9jz3KMScwTrjHj" alt="" width="375"><figcaption></figcaption></figure>

If you don't see the answer to your question here, please [reach out to us](https://loadium.com/contact-us/) to let us know! We're always improving our documentation.


# Report PDF Export old ui

How to export your reports as PDF file

## How to Use Loadium PDF Export Feature

Loadium has another useful feature for its customers; PDF Export.

\
With this feature, you can export a PDF file of your test report by selecting the metrics and information you want to view. This feature is only available to subscription members, you can take a look at [Loadium Subscription](https://wiki.loadium.com/account/subscription) page first.

### Step by Step How to Use&#x20;

1. Select the test of report you want to review.

<figure><img src="/files/jFersHRRIUBig6azVNQR" alt=""><figcaption></figcaption></figure>

2. The previously run tests will be displayed on this screen. On the test you want to view, click the "Report" button.

<figure><img src="/files/RIoqtG6cHYSDZsHZOoCB" alt=""><figcaption></figcaption></figure>

3. Click the "PDF Export" button on the right, top of test report page.

<figure><img src="/files/7PLYAwQIGqNJwJMybBya" alt=""><figcaption></figcaption></figure>

4. You can choose the metrics and data to include in your PDF report file on this screen.

<figure><img src="/files/z92oUxQlSOxRDKrfK40B" alt=""><figcaption></figcaption></figure>

#### An example PDF report file looks like this:

<div><figure><img src="/files/BR1Tnd9ggjSVc6rN4fln" alt=""><figcaption></figcaption></figure> <figure><img src="/files/dQ5FCMmgu4BIW2qxELqX" alt=""><figcaption></figcaption></figure></div>

#### You can easily export your report file and have a shorter summary of your test reports using Loadium PDF Export feature.


# Report PDF Export

## How to Use Loadium PDF Export Feature

Loadium has another useful feature for its customers; PDF Export.

\
With this feature, you can export a PDF file of your test report by selecting the metrics and information you want to view. This feature is only available to subscription members, you can take a look at [Loadium Subscription](https://wiki.loadium.com/account/subscription) page first.

### Step by Step How to Use&#x20;

1. Select the test of report you want to review.

<figure><img src="/files/eJ4lJE6zWZ6IOLQPicX8" alt=""><figcaption></figcaption></figure>

2. The previously run tests will be displayed on this screen. On the test you want to view, click the "Report" button.

<figure><img src="/files/v44kvbzf3PRqZS3rcv17" alt="" width="563"><figcaption></figcaption></figure>

3. Click the "PDF Export" button on the right, top of test report page.

<figure><img src="/files/08KwTWnMdGTjq0atgjMU" alt=""><figcaption></figcaption></figure>

4. You can choose the metrics and data to include in your PDF report file on this screen.

<figure><img src="/files/4RrE0SY1jIkypDjqKoDg" alt="" width="563"><figcaption></figcaption></figure>

#### An example PDF report file looks like this:

<div><figure><img src="/files/YbsLwvlk7cJehfuVYwMQ" alt=""><figcaption></figcaption></figure> <figure><img src="/files/2wkmP61YPdOR6IeVKlzr" alt=""><figcaption></figcaption></figure> <figure><img src="/files/cPAxLqoji3x0mKNRjZMX" alt=""><figcaption></figcaption></figure> <figure><img src="/files/C3mhWHDvjqwxiVKAg0DS" alt=""><figcaption></figcaption></figure> <figure><img src="/files/aO7o8PQimRTljOy55P1S" alt=""><figcaption></figcaption></figure></div>

{% hint style="success" %}
You can easily export your report file and have a shorter summary of your test reports using Loadium PDF Export feature.
{% endhint %}


# Private Location old ui

Creating Private Location and Agent

Private location is a system dedicated to perform load tests using your own systems with our agents, which allows you to bypass or satisfy the conditions for security environments such as firewall. Since the feature utilizes Docker containers, its installation and usage requires Docker software pre-installed.

## Creating a Private Location

* You can access to Private Location Page from the Account Page.

![](/files/-MYAHBCUxIdhlJHvPox5)

* You can simply click on the Add Private Location button and enter the desired parameters to create your private location.

![](/files/-M_PN0AxPueXiBtSsD8f)

## On Premise Parameters

![](/files/-M_PN6xPfsxw150qxT27)

1. **Name:** Name of the private location.
2. **Override number of CPUs:** Amount of CPUs to be consumed by the engines. It can be fractional number (i.e 3.5 will use 3 and a half CPU).
3. **Override memory:** Amount of memory (MB) to be consumed by the engines.
4. **JVM XMX:** Specifies the maximum memory allocation pool for the Java Virtual Machine (JVM)
5. **JVM XMS:** Specifies the initial memory allocation pool for the Java Virtual Machine (JVM)

* Once you create the private location, you will be directed to its details page, where you can edit the location or add agents to it.

![](/files/-MYAIDLYxPO1is22F6ZI)

{% hint style="warning" %}
**Note:** Before you can add an agent, you need to generate **Access Key** from the Account Page. This key ensures the security of transactions between your requests and our services.

&#x20;                                    <img src="/files/-M_PjNeSXGU5Z8EELW1q" alt="" data-size="original">
{% endhint %}

## Creating Agent and Running on Docker

* Only name is required for creating an agent. Once you create the agent, you will be presented with the docker command which you can use to create and run docker container for your private location.

&#x20;                                                    <img src="/files/-M_Pmq7q9rw0OwHZHymd" alt="" data-size="original">&#x20;

![](/files/-M_PoHgDzXZqRoKIhSNE)

![](/files/-M_Pp-KA4r3rqjvVH5un)

{% hint style="info" %}
**Note:** If you have lost your docker command for the agent, you can simply Regenerate it.

&#x20;                                       <img src="/files/-M_PX3pkWyCGaq4iYHEf" alt="" data-size="original">&#x20;
{% endhint %}

* After you generated the command, just run it on console and the installation process will start.

![](/files/-M_PQ1k08GpgMNj91IVJ)

{% hint style="info" %}
**Note:** If you are using **Windows** operating system, there are additional steps to setup docker containers before running. You can find the details [here](https://docs.microsoft.com/en-us/virtualization/windowscontainers/quick-start/quick-start-windows-10-linux).
{% endhint %}

{% hint style="info" %}
**Note:** In case you changed the agent’s name, docker command will be regenerated automatically. However, to start the container with the new name, you need to delete the previous container with the old name from docker.
{% endhint %}

* After installation process is finished, you can confirm if the operation is successful by checking its Status and Last Heartbeat in the Private Location page (you might need to refresh the page).&#x20;

![](/files/-M_Pd1wgbUlB5wnmigty)

#### Agent Statuses

* **Idle:** Node is connected, available for a test run.
* **Running:** Node is currently busy, running a test.
* **Finished:** Node has just completed a test (still busy), finalizing the processes then will become Idle.
* **Time Out:** Node is disconnected, no updates received from the node.

## Starting Test With Private Location

In order to use the created private location, you can simply select it from Geolocation segment in Test Create/Edit Page. It will use the first available (idle) agents to start the test.

![](/files/-M_PkE1eYftaLaBYTSn6)

{% hint style="info" %}
**Note:** Considering the test's configuration, each engine requires an available agent from the selected private location. If there aren't enough agents then the test will not start.
{% endhint %}

{% hint style="warning" %}
**Additional Note:** If there is a VPN requirement for the endpoint you are testing, and since the test will run on a Docker container, sometimes Docker cannot utilize the VPN connection. So make sure to start VPN connection first then start Docker, or restart Docker after VPN connection is established.
{% endhint %}

Enjoy Load testing!

{% content-ref url="/pages/-MUSA3fXQEXUc1CFlYx1" %}
[Broken mention](broken://pages/-MUSA3fXQEXUc1CFlYx1)
{% endcontent-ref %}

{% content-ref url="/pages/-MUSAunBwe2J09CIl1hu" %}
[JMeter Test](/create-test/jmeter-test)
{% endcontent-ref %}

{% content-ref url="/pages/-MUSDT9m95VYzdFJ536o" %}
[Sandbox](/test-settings/what-is-sandbox)
{% endcontent-ref %}

If you don't see the answer to your question here, please [reach out to us](https://loadium.com/contact-us/) to let us know! We're always improving our documentation.


# Private Location

Creating Private Location and Agent

Private location is a system dedicated to perform load tests using your own systems with our agents, which allows you to bypass or satisfy the conditions for security environments such as firewall. Since the feature utilizes Docker containers, its installation and usage requires Docker software pre-installed.

## Creating a Private Location

* You can access to Private Location Page from the Account Page.

<figure><img src="/files/eLLujfwWyrkGoLiYOkAB" alt=""><figcaption></figcaption></figure>

* You can simply click on the Create Location button and enter the desired parameters to create your private location.

<figure><img src="/files/gkQKI1nLJDkcvtPzD32K" alt=""><figcaption></figcaption></figure>

## On Premise Parameters

<figure><img src="/files/e3acfsuhVAL2fhGrC0TN" alt=""><figcaption></figcaption></figure>

1. **Name:** Name of the private location.
2. **User per engine:** Specifies the number of virtual users assigned to each private location engine for test execution.
3. **Override number of CPUs:** Amount of CPUs to be consumed by the engines. It can be fractional number (i.e 3.5 will use 3 and a half CPU).
4. **Override memory:** Amount of memory (MB) to be consumed by the engines.
5. **JVM XMX:** Specifies the maximum memory allocation pool for the Java Virtual Machine (JVM)
6. **JVM XMS:** Specifies the initial memory allocation pool for the Java Virtual Machine (JVM)

* Once you create the private location, you will be directed to its details page, where you can edit the location or add agents to it.

<figure><img src="/files/ph9zmQI6yg22gGD4yDfQ" alt=""><figcaption></figcaption></figure>

{% hint style="warning" %}
**Note:** Before you can add an agent, you need to generate **Access Key** from the Account Page. This key ensures the security of transactions between your requests and our services.

<p align="center"> <img src="/files/Vkvr8tz6vWV89GYk8RxI" alt="" data-size="original">    </p>
{% endhint %}

## Creating Agent and Running on Docker

* Only name is required for creating an agent. Once you create the agent, you will be presented with the docker command which you can use to create and run docker container for your private location.

<figure><img src="/files/FjC3CD8yxxTQ0qiXESTH" alt=""><figcaption></figcaption></figure>

<figure><img src="/files/nNA5mA700MKBVvT7dX59" alt=""><figcaption></figcaption></figure>

<figure><img src="/files/w968kGYmxLsMNp7sJnJ0" alt=""><figcaption></figcaption></figure>

{% hint style="info" %}
**Note:** If you have lost your docker command for the agent, you can simply Regenerate it.

<p align="center"><img src="/files/rZR1PKYwpyheacLpovGE" alt=""></p>
{% endhint %}

* After you generated the command, just run it on console and the installation process will start.

<figure><img src="/files/Tg2ohHUgoP8xjBkvG09v" alt=""><figcaption></figcaption></figure>

{% hint style="info" %}
**Note:** If you are using **Windows** operating system, there are additional steps to setup docker containers before running. You can find the details [here](https://docs.microsoft.com/en-us/virtualization/windowscontainers/quick-start/quick-start-windows-10-linux).
{% endhint %}

{% hint style="info" %}
**Note:** In case you changed the agent’s name, docker command will be regenerated automatically. However, to start the container with the new name, you need to delete the previous container with the old name from docker.
{% endhint %}

* After installation process is finished, you can confirm if the operation is successful by checking its Status and Last Heartbeat in the Private Location page (You might need to refresh the page, and you may need to log into your account again).&#x20;

<figure><img src="/files/rTx1qIE2jnHzDR2XBG44" alt=""><figcaption></figcaption></figure>

#### Agent Statuses

* **Idle:** Node is connected, available for a test run.
* **Running:** Node is currently busy, running a test.
* **Finished:** Node has just completed a test (still busy), finalizing the processes then will become Idle.
* **Time Out:** Node is disconnected, no updates received from the node.

## Starting Test With Private Location

In order to use the created private location, you can simply select it from Geolocation segment in Test Create/Edit Page. It will use the first available (idle) agents to start the test.

<figure><img src="/files/MVM5EBg7IdJsOoYbIfDa" alt=""><figcaption></figcaption></figure>

{% hint style="info" %}
**Note:** Considering the test's configuration, each engine requires an available agent from the selected private location. If there aren't enough agents then the test will not start.
{% endhint %}

{% hint style="warning" %}
**Additional Note:** If there is a VPN requirement for the endpoint you are testing, and since the test will run on a Docker container, sometimes Docker cannot utilize the VPN connection. So make sure to start VPN connection first then start Docker, or restart Docker after VPN connection is established.
{% endhint %}

If you don't see the answer to your question here, please [reach out to us](https://loadium.com/contact-us/) to let us know! We're always improving our documentation.


# Split CSV old ui

What is , How to Use & Things to Pay Attention

## What is Split CSV

If you are planning to use CSV data and require more than one engine for your test, and if you want each engine to use unique values from the .csv file, you can use Split CSV feature. What Split CSV does is, it divides .csv files to engine count (2 engine count will divide the csv file in half), so that each engine will have different segment of the .csv, thus engines will have unique data.

&#x20;Let's take a look at the following example:

We want to use 10 engines, each with 500 threads, 5.000 threads in total, and you have uploaded .csv file with 5.000 user data. If you want different user data to be sent to each engine and if you select the "Split CSV" option, the CSV will be divided into 10 and different segments of the file will be sent to each engine.&#x20;

{% hint style="info" %}
If your test scenario has login, and multiple logins of same user will drop each other's session, it is crucial to have unique data on each engine.
{% endhint %}

{% hint style="warning" %}
Engine count cannot be higher than .csv file's column amount.
{% endhint %}

## Use of Split CSV

First upload your CSV file from the ‘Upload’ field. After activating the Split CSV field below, you select your CSV file that needs to be split.

<figure><img src="/files/Lv7LWnlIbKX7Zw28qlCE" alt=""><figcaption></figcaption></figure>

You can split multiple csv's:

<figure><img src="/files/Uh4oon9WgCPEjC2KqC9i" alt=""><figcaption></figcaption></figure>

## Things To Pay Attention

{% hint style="warning" %}
The path of the .csv file should only be name of the file (Absolute path should be given).

~~/MyUsername/MyDocuments/users.csv~~  ==>>  users.csv
{% endhint %}

* The file extension should be .csv (not txt, excel etc.).
* Variable Names fields should be given as they are separated in the file.&#x20;
* Delimiter part to indicate how you separate your parameters in csv.&#x20;

You can see an example below.

![](/files/-M_yLfDUDNkSmpywmiSo)


# Split CSV

What is , How to Use & Things to Pay Attention

## What is Split CSV

If you are planning to use CSV data and require more than one engine for your test, and if you want each engine to use unique values from the .csv file, you can use Split CSV feature. What Split CSV does is, it divides .csv files to engine count (2 engine count will divide the csv file in half), so that each engine will have different segment of the .csv, thus engines will have unique data.

&#x20;Let's take a look at the following example:

We want to use 10 engines, each with 500 threads, 5.000 threads in total, and you have uploaded .csv file with 5.000 user data. If you want different user data to be sent to each engine and if you select the "Split CSV" option, the CSV will be divided into 10 and different segments of the file will be sent to each engine.&#x20;

{% hint style="info" %}
If your test scenario has login, and multiple logins of same user will drop each other's session, it is crucial to have unique data on each engine.
{% endhint %}

{% hint style="warning" %}
Engine count cannot be higher than .csv file's column amount.
{% endhint %}

{% hint style="warning" %}
When using the Split CSV feature, ensure the first row contains a header; otherwise, the first row of each split file may repeat the same value.

<p align="center"><img src="/files/Segeu48xSfk4hGC1QG3R" alt=""></p>
{% endhint %}

## Use of Split CSV

First upload your CSV file from the ‘Upload’ field. After uploading your CSV files, you can enable the Split CSV option by toggling the switch next to each file.

<figure><img src="/files/PkkhJxf1coQbVHscgC9C" alt=""><figcaption></figcaption></figure>

You can split multiple csv's:

<figure><img src="/files/sobhb4IWkBP819PzVrzn" alt=""><figcaption></figcaption></figure>

## Things To Pay Attention

{% hint style="warning" %}
The path of the .csv file should only be name of the file (Absolute path should be given).

~~/MyUsername/MyDocuments/users.csv~~  ==>>  users.csv
{% endhint %}

* The file extension should be .csv (not txt, excel etc.).
* Variable Names fields should be given as they are separated in the file.&#x20;
* Delimiter part to indicate how you separate your parameters in csv.&#x20;

You can see an example below.

![](/files/-M_yLfDUDNkSmpywmiSo)


# Debug Test

You can create a free, 5-user debug test to verify everything before starting the actual test. These tests will not consume any test usages.

<figure><img src="/files/0SfmWUAbugKdMH0lyFGs" alt=""><figcaption><p>Debug Test Button</p></figcaption></figure>

Debug test configuration is as follows:&#x20;

<figure><img src="/files/NJ75FMl27Eo1OMC7lnJ0" alt="" width="563"><figcaption><p>5-User, 1-Engine Debug Test Configuration</p></figcaption></figure>

You can disable Debug Mode from the button shown below:

<figure><img src="/files/cTV1nLOw7rXXAfqU9RGu" alt="" width="563"><figcaption></figcaption></figure>

{% hint style="warning" %}
**Note:** Dedicated IPs are not supported with Debug tests.
{% endhint %}


# Sandbox

You can create a free, 5-user sandbox test to verify everything before starting the actual test. These tests will not consume any test usages.

Sandbox configuration is as follows:&#x20;

<figure><img src="/files/f0AaVC11qTWH20SItWPY" alt=""><figcaption></figcaption></figure>

{% hint style="warning" %}
**Note:** Dedicated IPs are not supported with Sandbox tests.
{% endhint %}


# Multi-Step

You can create a 'gradually increasing load' configuration during test creation with the Multi-Step option in the Configuration section in the test Create / Edit page.

Let's take a look at the following example:

We want to run the test with a maximum of 5000 users, increasing by 1000 users every 2 minutes. With default settings, Loadium will create the test with Linear Load Type. If you want to apply by increasing the load select "Multi-Step" on Configuration area.

<figure><img src="/files/aFz0Pvdy7KChiIKwScCT" alt="Multi-Step Checkbox and Configuration"><figcaption><p>Multi-Step Checkbox and Configuration</p></figcaption></figure>

Enter the target number of virtual users in the "Target VU" field, specify the duration (in seconds) for ramping up to this load in the "Ramp-up" field, and define how long (in minutes) the load should be sustained in the "Hold" field.

{% hint style="info" %}
The time entered in the "Hold" field includes the "Ramp-up" time.
{% endhint %}

We add 5 steps to simulate the scenario in our example.

{% hint style="info" %}
The value entered in the "Target VU" field represents the maximum number of users at that point in the test; it does not indicate the amount of increase.

In this example, the maximum load we will apply to the system at the end of step 5 will be 5000.
{% endhint %}

If you want to increase the number of steps, you can add steps by clicking the "Add Step" button.

## Things To Pay Attention

{% hint style="warning" %}
The Sandbox feature cannot be used for Multi-Step tests.
{% endhint %}

{% hint style="warning" %}
The test time is the sum of the Hold times.
{% endhint %}

{% hint style="warning" %}
For VUH usage accounts, the amount of VUH deducted from your account after the test is calculated based on the Target VU in the last step you added and the sum of the Hold times.
{% endhint %}


# Geolocation old ui

## What is Geolocation?

Loadium, in brief, is a pipeline tool that allows you to command remote servers to send requests to your system. These remote servers are physically located in many places around the world. Loadium is integrated with Amazon AWS, Microsoft Azure and Google Cloud engine providers.

Loadium's Geolocation feature allows you to select the desired location to receive requests from. Moreover, the location that is chosen for the servers might have impact on the test depending on the configuration or the location of the receiving servers.

## How to Use Geolocation

After you select your test type from "New Test" page, you will be presented with Geolocation configuration at the lower section of the page.

Here, you will be able to select the desired region, and the amount for the load engines.

![](/files/-M_QwKlA2mxO0lnPS2HD)

Multiple regions can be added to the configuration.&#x20;

![](/files/-M_QxHhuKxmhIKprMW7n)

![](/files/-M_QwXXWy9RLwzBo7KWg)

{% hint style="info" %}
**Note:** The total engine count in the "Geolocation" section must be equal to the engine count in "Configuration" section.
{% endhint %}

## Available Regions&#x20;

### Amazon Web Services

* EU - Ireland
* EU - Frankfurt
* EU - London
* EU - Paris
* US East - Ohio
* US East - N. Virginia
* US West - N. California
* US West - Oregon
* Canada - Central
* Asia Pacific - Tokyo
* Asia Pacific - Seoul
* Asia Pacific - Singapore
* Asia Pacific - Sydney
* Asia Pacific - Mumbai
* South America - Sao Paulo

### Microsoft Azure

* Germany West Central
* Australia Central
* Canada East
* Central India
* Central US
* East US
* Japan East
* North Europe
* South Central Us
* UAE North
* West Europe
* West US
* Sweden Central

### Google Cloud Platform

* Belgium
* Zurich

## Why Geolocation is Important?

One crucial reason to utilize geolocation feature could be the location of the receiving server. For example, if the receiving server is located in Asia, the geolocation for requesting servers advised to be selected close to Asia, otherwise the average connection time (the time that it takes a request to reach to receiving server) will be higher than usual. This situation might cause the test to be executed slower, affecting it negatively.

Another reason to utilize geolocation could be using multi location feature to distribute the incoming heavy traffic to achieve more natural, realistic test. Moreover, besides achieving a realistic test, receiving traffic from multiple locations could be more friendly with the ISP's and server configurations. Because sometimes, ISP's or the server's configurations (load balancer etc.) might not act as expected (ISP's might interpret it as DDoS situation, or the load balancer could not distribute the requests properly) if it's coming from only one location.


# Geolocation

## What is Geolocation?

Loadium, in brief, is a pipeline tool that allows you to command remote servers to send requests to your system. These remote servers are physically located in many places around the world. Loadium is integrated with Amazon AWS, Microsoft Azure and Google Cloud engine providers.

Loadium's Geolocation feature allows you to select the desired location to receive requests from. Moreover, the location that is chosen for the servers might have impact on the test depending on the configuration or the location of the receiving servers.

## How to Use Geolocation

After you select your test type from "Create" page, you will be presented with Geolocation configuration at the lower section of the page.

Here, you will be able to select the desired region, and the amount for the load engines.

<figure><img src="/files/Lkc85lKVw4IG6h6UwDho" alt=""><figcaption></figcaption></figure>

Multiple regions can be added to the configuration.&#x20;

<figure><img src="/files/sgwSF2Rd9EWqSF5VS3tM" alt=""><figcaption></figcaption></figure>

{% hint style="info" %}
**Note:** The total engine count in the "Geolocation" section must be equal to the engine count in "Configuration" section.
{% endhint %}

<figure><img src="/files/gl5nDNLX4MfTZ66lBhkx" alt=""><figcaption></figcaption></figure>

## Available Regions&#x20;

### Oracle Cloud

* EU - Frankfurt
* Australia East - Sydney
* Australia Southeast - Melbourne
* France Central - Paris
* Italy Northwest - Milan
* Netherlands Northwest - Amsterdam
* Spain Central - Madrid
* Sweden Central - Stockholm
* UAE Central - Abu Dhabi
* UAE East - Dubai

### Amazon Web Services

* EU - Ireland
* EU - Frankfurt
* EU - London
* EU - Paris
* US East - Ohio
* US East - N. Virginia
* US West - N. California
* US West - Oregon
* Canada - Central
* Asia Pacific - Tokyo
* Asia Pacific - Seoul
* Asia Pacific - Singapore
* Asia Pacific - Sydney
* Asia Pacific - Mumbai
* South America - Sao Paulo

### Microsoft Azure

* Germany West Central
* Australia Central
* Canada East
* Central India
* Central US
* East US
* Japan East
* North Europe
* South Central Us
* UAE North
* West Europe
* West US
* Sweden Central

### Google Cloud Platform

* Belgium
* Zurich

## Why Geolocation is Important?

One crucial reason to utilize geolocation feature could be the location of the receiving server. For example, if the receiving server is located in Asia, the geolocation for requesting servers advised to be selected close to Asia, otherwise the average connection time (the time that it takes a request to reach to receiving server) will be higher than usual. This situation might cause the test to be executed slower, affecting it negatively.

Another reason to utilize geolocation could be using multi location feature to distribute the incoming heavy traffic to achieve more natural, realistic test. Moreover, besides achieving a realistic test, receiving traffic from multiple locations could be more friendly with the ISP's and server configurations. Because sometimes, ISP's or the server's configurations (load balancer etc.) might not act as expected (ISP's might interpret it as DDoS situation, or the load balancer could not distribute the requests properly) if it's coming from only one location.


# Users Per Engine Configuration

You can set the number of virtual users to initialize per engine before tests.

Let's take a look at the following example:

We want to run the tests with 1000 virtual users. With default settings, Loadium will start this test with 2 engines, 500 threads per engine. If you want to define a specific number of virtual users less than 500 per engine, click "Select Users Per Engine" button below.

<figure><img src="/files/BhuMK9rjjMxqogHP7ENt" alt="" width="375"><figcaption><p>Select Users Per Engine Button</p></figcaption></figure>

Enable the "Select Users Per Engine" button. Enter the Users Per Engine value you want to initialize per engine in the Users Per Engine field.

<figure><img src="/files/2XI32JjJySq0o5B5BNEt" alt="" width="375"><figcaption><p>50 users per engine, total 20 engines will be initialized</p></figcaption></figure>

## When To Use&#x20;

If there is an IP-based rate limit or connection limit on the servers you test, you can reduce the number of initialized users per IP by using this feature.

## Things To Pay Attention

{% hint style="warning" %}
If you are going to use a dedicated ip, make sure that the number of engines you set is not more than the number of dediceted ips in your account.
{% endhint %}


# Dedicated IP old ui

What is , How to Use & Things to Pay Attention

## What is Dedicated IP?

Dedicated IP is a private IP address made available to you only.&#x20;

Sometimes you may need to bypass a firewall or DDoS protection to achieve performance tests, in such cases you need to have specific IP addresses to whitelist. For this reason, Loadium has made it possible for you to assign Dedicates IPs to its engines. Each IP address belongs to a specific region. There must be a dedicated IP for each engine.&#x20;

For example: &#x20;

* 5 engines = 5 Dedicated IPs&#x20;
* 50 engines = 50 Dedicated IPs&#x20;
* 100 engines = 100 Dedicated IPs&#x20;

{% hint style="success" %}
To request private IP for your Loadium account, you can [contact us here](https://loadium.com/contact-us/).
{% endhint %}

## Your Dedicated IPs

In order to see your dedicated IPs, you need to click the profile button in the upper right corner and come to the account page.

&#x20;                                            <img src="/files/-M_t0GPpqNv0qMRc-893" alt="" data-size="original">&#x20;

On the account page, you can see all your IPs by clicking the "DEDICATED IP" tab that is above the page. &#x20;

![](/files/8Iy5AobPB8InqrzVgNIO)

On this screen, you can track your dedicated IPs. The table will show you all the Dedicated IPs associated with your account. In the table, you can see the all information about your dedicated IPs such as region name, address, status and related tests.

![](/files/-M_t1C5RnnrbjknOf4lZ)

## How to Use

While creating a new test or editing a test, you need to select the regions where your dedicated IPs are located in the Geolocation field.

![](/files/-M_t6DrgNBvLP2OX9YwY)

* The "Use Dedicated IP" option must be checked.

![](/files/-M_t6us_IimpuOe7gv8g)

That's it. Now when you start the test, it will use IP's from your Dedicated IP pool (the selection is randomized).

## Available Regions&#x20;

### Amazon Web Services

1. EU - Ireland
2. EU - Frankfurt
3. EU - London
4. EU - Paris
5. US East - Ohio
6. US East - N. Virginia
7. US West - N. California
8. US West - Oregon
9. Canada - Central
10. Asia Pacific - Tokyo
11. Asia Pacific - Seoul
12. Asia Pacific - Singapore
13. Asia Pacific - Sydney
14. Asia Pacific - Mumbai
15. South America - Sao Paulo

### Microsoft Azure

1. Germany West Central
2. Australia Central
3. Canada East
4. Central India
5. Central US
6. East US
7. Japan East
8. North Europe
9. South Central Us
10. UAE North
11. West Europe
12. West US
13. Sweden Central

### Google Cloud Platform

1. Belgium
2. Zurich

{% hint style="success" %}
To request private IP for your Loadium account, you can [contact us here](https://loadium.com/contact-us/).
{% endhint %}

#### That's all :) Enjoy testing!&#x20;

{% content-ref url="/pages/-MUSAunBwe2J09CIl1hu" %}
[JMeter Test](/create-test/jmeter-test)
{% endcontent-ref %}

{% content-ref url="/pages/-MUSE7GXKewmLpQmOWWW" %}
[Geolocation old ui](/test-settings/what-is-geolocation)
{% endcontent-ref %}

{% content-ref url="/pages/-MUT5hLDUtoTsSYDaFkV" %}
[Pricing OLD](/about-loadium/pricingold)
{% endcontent-ref %}

If you don't see the answer to your question here, please [reach out to us](https://loadium.com/contact-us/) to let us know! We're always improving our documentation.


# Dedicated IP

What is , How to Use & Things to Pay Attention

## What is Dedicated IP?

Dedicated IP is a private IP address made available to you only.&#x20;

Sometimes you may need to bypass a firewall or DDoS protection to achieve performance tests, in such cases you need to have specific IP addresses to whitelist. For this reason, Loadium has made it possible for you to assign Dedicates IPs to its engines. Each IP address belongs to a specific region. There must be a dedicated IP for each engine.&#x20;

For example: &#x20;

* 5 engines = 5 Dedicated IPs&#x20;
* 50 engines = 50 Dedicated IPs&#x20;
* 100 engines = 100 Dedicated IPs&#x20;

{% hint style="success" %}
To request private IP for your Loadium account, you can [contact us here](https://loadium.com/contact-us/).
{% endhint %}

## Your Dedicated IPs

In order to see your dedicated IPs, you need to click the profile button in the upper right corner and come to the account page.

<figure><img src="/files/GlIjgnEtCwDtpay8MXYR" alt=""><figcaption></figcaption></figure>

On the account page, you can see all your IPs by clicking the "DEDICATED IP" tab that is above the page. &#x20;

<figure><img src="/files/B6P3p6dBG7KJejhtAFE2" alt=""><figcaption></figcaption></figure>

On this screen, you can track your dedicated IPs. The table will show you all the Dedicated IPs associated with your account. In the table, you can see the all information about your dedicated IPs such as region name, IP address, status and expire dates.

{% hint style="info" %}
**Note:** Use the Export button in the upper-right corner to download the IPs.

<p align="center"><img src="/files/6o4urhHOkDfjMI7XKcH7" alt=""></p>
{% endhint %}

## How to Use

To use dedicated IPs during your test, enable the “Use Dedicated IP” switch under the Geolocation section.

<figure><img src="/files/jtZvQ1BDUpkZYaGaHfGv" alt=""><figcaption></figcaption></figure>

The IPs will be displayed once the region provider they are assigned to is selected.

<figure><img src="/files/q0fdAwEsYC8sFN7JAajz" alt=""><figcaption></figcaption></figure>

That's it. Now when you start the test, it will use IP's from your Dedicated IP pool (the selection is randomized).

## Available Regions&#x20;

### Oracle Cloud

1. EU - Frankfurt
2. Australia East - Sydney
3. Australia Southeast - Melbourne
4. France Central - Paris
5. Italy Northwest - Milan
6. Netherlands Northwest - Amsterdam
7. Spain Central - Madrid
8. Sweden Central - Stockholm
9. UAE Central - Abu Dhabi
10. UAE East - Dubai

### Amazon Web Services

1. EU - Ireland
2. EU - Frankfurt
3. EU - London
4. EU - Paris
5. US East - Ohio
6. US East - N. Virginia
7. US West - N. California
8. US West - Oregon
9. Canada - Central
10. Asia Pacific - Tokyo
11. Asia Pacific - Seoul
12. Asia Pacific - Singapore
13. Asia Pacific - Sydney
14. Asia Pacific - Mumbai
15. South America - Sao Paulo

### Microsoft Azure

1. Germany West Central
2. Australia Central
3. Canada East
4. Central India
5. Central US
6. East US
7. Japan East
8. North Europe
9. South Central Us
10. UAE North
11. West Europe
12. West US
13. Sweden Central

### Google Cloud Platform

1. Belgium
2. Zurich

{% hint style="success" %}
To request private IP for your Loadium account, you can [contact us here](https://loadium.com/contact-us/).
{% endhint %}

If you don't see the answer to your question here, please [reach out to us](https://loadium.com/contact-us/) to let us know! We're always improving our documentation.


# Send Email old ui

Guide for using send email feature

It is possible to be notified with ‘Send Email Feature’ of Loadium, about the status of your tests. This feature is located on the new test starting pages, at the bottom of the page.

After uploading your test files and determining the parameters, you can decide on which cases you want to be notified via email.

#### The Cases:

* Test Started&#x20;
* Test Finished
* Test Failed

You can choose among these specific cases. Besides your own email address, you can add different email addresses to this area, and let your team members know about test status.

![](/files/iDFbnPQjZwppKkLfSVsu)

As shown above, you can follow these steps;

1. Turn on the Send Email button,
2. Add an email address,
3. Select one or more rule labels and click on the ‘Add’ button.

You can add email addresses one by one and edit them later. You can delete or update them by changing the rule labels in line with your needs.

Please [contact us](https://loadium.com/contact-us), if you have any questions or recommendations.


# Send Email

Guide for using send email feature

It is possible to be notified about the status of your tests using Loadium’s ‘Send Email’ feature. This option is located in the JMeter Settings section on the New Test page.

<figure><img src="/files/ycznrHsPjt5yJFW6P0Zo" alt=""><figcaption></figcaption></figure>

After uploading your test files and determining the parameters, you can decide on which cases you want to be notified via email.

#### The Cases:

* Test Started&#x20;
* Test Finished
* Test Failed
* Test Crashed
* Test Completed

You can choose among these specific cases. Besides your own email address, you can add different email addresses to this area, and let your team members know about test status.

<figure><img src="/files/ztoqJ2aLjNqzBIiMfoVQ" alt=""><figcaption></figcaption></figure>

As shown above, you can follow these steps;

1. Turn on the Send Email button,
2. Add an email address,
3. Select one or more rule labels and click on the ‘Add’ button.

You can add email addresses one by one and edit them later. You can delete or update them by changing the rule labels in line with your needs.

<figure><img src="/files/FlvDGOE9QKEWVxY1yeg1" alt=""><figcaption></figcaption></figure>

Please [contact us](https://loadium.com/contact-us), if you have any questions or recommendations.


# DNS Override old ui

You can manually configure DNS settings of specific domains. This feature is used in test scenarios to redirect specific hostnames to fixed IP addresses.

If you want DNS queries to be directed to specific IP addresses, enable DNS Override button below.

<figure><img src="/files/gr4UQ5jhnE5EdoFcs7Ll" alt=""><figcaption><p>DNS Override Switch</p></figcaption></figure>

You can direct DNS queries to specific addresses by typing the domain name in the Host name field and the IP value you want to match in the IP field.

<figure><img src="/files/aQGrDh8HYxEdEMOg7K8v" alt=""><figcaption><p>DNS Configurations</p></figcaption></figure>

{% hint style="warning" %}
Make sure IP addresses and domain names are written correctly.
{% endhint %}

{% hint style="warning" %}
Carefully manage static records to ensure consistency across different test scenarios.
{% endhint %}


# DNS Override

You can manually configure DNS settings of specific domains. This feature is used in test scenarios to redirect specific hostnames to fixed IP addresses.

If you want DNS queries to be directed to specific IP addresses, enable DNS Override button below.

<figure><img src="/files/MJYoLUJv1csaVwQwHHek" alt="DNS Override Switch"><figcaption><p>DNS Override Switch</p></figcaption></figure>

You can direct DNS queries to specific addresses by typing the domain name in the Host name field and the IP value you want to match in the IP field.

<figure><img src="/files/8AlrDAGu0FThGHr35mDW" alt=""><figcaption><p>Example DNS Configuration</p></figcaption></figure>

{% hint style="warning" %}
Make sure IP addresses and domain names are written correctly.
{% endhint %}

{% hint style="warning" %}
Carefully manage static records to ensure consistency across different test scenarios.
{% endhint %}

{% hint style="info" %}
Multiple DNS customizations can be added.

<p align="center"><img src="/files/0mSzLQkZT2HU7v9o0Ohj" alt=""></p>
{% endhint %}


# TPS old ui

What is , How to Use & Things to Pay Attention

## What is TPS?

Usually **T**ransaction **P**er **S**econd (TPS), which plays an important role in load testing, shows the number of processes completed in one second. In other words, it can be calculated based on how many transactions are executed over a certain duration of the test and then calculate it for a second.

TPS (Transaction per Second) and response times are related. The following relationship is between TPS, concurrent virtual users and response time:

&#x20;$$TPS = Virtual User / (response time + think time )$$

![Jmeter - Transaction Per Second](/files/-Ma7i_Glq2m69r0PWSjc)

The graph below shows the average response time as 800ms.

If we calculate TPS, 5 / 0.8sec = 6.25 TPS (VirtualUser / Response Time = TPS)

![Jmeter Aggregate Report](/files/-Ma7j5GVyg7757rzGaHE)

## **How to Use TPS**

In this example we will use jmeter

Create -> JMeter Test -> Limit TPS

<figure><img src="/files/TScoinQdgajJrnkoNCq7" alt=""><figcaption></figcaption></figure>

We enter that value as much as we want to limit TPS.

![](/files/-Ma7kyIEP9Somop4_8hI)

We run the test.

You can see the hit values in the "Hits & Errors" graph in the Overview in the test report.

![](/files/-Ma7lB9273JrHzb8q65U)

At the same time, we can see that the "Avg. Throughput / RPS" value in the "Summary Report" tab is limited to 10.

![](/files/-Ma7lXn67Jmwp9jxnUmM)

If we run the same test without TPS limit, we can see that the "Avg. Throughput / RPS" value is quite high, as seen below.

![](/files/-Ma7lpVsBeiNYwrWifrE)

In summary, TPS in the performance test cannot be used as a performance metric alone. Transaction on execution time can be analyzed by comparing TPS with average transaction response time.

Happy testing!

{% content-ref url="/pages/-MUSAunBwe2J09CIl1hu" %}
[JMeter Test](/create-test/jmeter-test)
{% endcontent-ref %}

If you don't see the answer to your question here, please [reach out to us](https://loadium.com/contact-us/) to let us know! We're always improving our documentation.


# TPS

What is , How to Use & Things to Pay Attention

## What is TPS?

Usually **T**ransaction **P**er **S**econd (TPS), which plays an important role in load testing, shows the number of processes completed in one second. In other words, it can be calculated based on how many transactions are executed over a certain duration of the test and then calculate it for a second.

TPS (Transaction per Second) and response times are related. The following relationship is between TPS, concurrent virtual users and response time:

&#x20;$$TPS = Virtual User / (response time + think time )$$

![Jmeter - Transaction Per Second](/files/-Ma7i_Glq2m69r0PWSjc)

The graph below shows the average response time as 800ms.

If we calculate TPS, 5 / 0.8sec = 6.25 TPS (VirtualUser / Response Time = TPS)

![Jmeter Aggregate Report](/files/-Ma7j5GVyg7757rzGaHE)

## **How to Use TPS**

In this example we will use jmeter

Create -> JMeter Test -> Limit TPS

<figure><img src="/files/etOmpUPfC089ZZPFRs9D" alt=""><figcaption></figcaption></figure>

We enter that value as much as we want to limit TPS.

<figure><img src="/files/yO6VNsAGBQfa44Ou1Sb9" alt=""><figcaption></figcaption></figure>

{% hint style="info" %}
The value entered as the limit is multiplied by the number of engines used in the test. For example, since this test runs with 2 engines, a limit value of 2 will be reflected in the report as 2 × 2 = 4.

<p align="center"><img src="/files/WcREnyOmDSBysYzqnZtB" alt=""></p>
{% endhint %}

We run the test.

You can see the hit values in the "Hits & Errors" graph in the Overview in the test report.

<figure><img src="/files/TLbaTTYz6nXajSK5mvzx" alt=""><figcaption></figcaption></figure>

At the same time, we can see that the "Avg. Throughput" value in the "Overview" tab is limited to 3.39.

<figure><img src="/files/5afdd9TjPpDXzTuq8itm" alt=""><figcaption></figcaption></figure>

If we run the same test without TPS limit, we can see that the "Avg. Throughput" value is quite high, as seen below.

<figure><img src="/files/IQruAM9qfFxzkaJBbfhu" alt=""><figcaption></figcaption></figure>

In summary, TPS in the performance test cannot be used as a performance metric alone. Transaction on execution time can be analyzed by comparing TPS with average transaction response time.

If you don't see the answer to your question here, please [reach out to us](https://loadium.com/contact-us/) to let us know! We're always improving our documentation.


# Network Type old

What is , How to Use & Things to Pay Attention

Many people nowadays connect to the internet with their cell phones. Due to this, load from mobile sites has increased and the performance of mobile sites has also increased depending on the fluctuations in the networks.&#x20;

Mobile device users access the internet through their own networks. Therefore, internet speeds will vary depending on their location. Sometimes, users have problems accessing web applications from their mobile devices. One of the reasons for this is the different network bandwidths.&#x20;

### What is Bandwidth?

Bandwidth refers to Data Traffic, Data Transfer Speed and Bandwidth can be defined as the instant capacity of your internet connection. Bandwidth is the measurement of data capacity in communication sources in byte/second or bit/second.&#x20;

### Network Type With Loadium&#x20;

We need to make sure that websites or mobile applications work on every condition without affecting the user experience with functional and non-functional aspects in different internet connection speeds.&#x20;

You can select multiple network types on Loadium.  First you have to create a new Test.&#x20;

<figure><img src="/files/TScoinQdgajJrnkoNCq7" alt=""><figcaption></figcaption></figure>

&#x20;

So  You can create a realistic load with the different type of bandwidth usage. Don’t forget that this kind of  configurations is very useful when it comes to testing Black Friday, Cyber Monday scenarios.&#x20;

![Network Types List](/files/UpS1S18EH8UZtdVepS5H)

Cps(characters per second) values vary according to speed&#x20;

| Network Type   | Speed       | CPS      |
| -------------- | ----------- | -------- |
| Fast Ethernet  | 100 Mbit/s  | 12800000 |
| WIFI 802.11a/g | 54 Mbit/s   | 6912000  |
| ADSL2+         | 24 Mbit/s   | 3072000  |
| HSPA+          | 21 Mbp/s    | 2688000  |
| HSPA           | 14,4 Mbp/s  | 1843200  |
| ADSL2          | 12 Mbit/s   | 1536000  |
| HSPA+          | 8 Mbit/s    | 1024000  |
| Ethernet LAN   | 10 Mbit/s   | 1280000  |

Enjoy load testing!

{% content-ref url="/pages/-MUSA3fXQEXUc1CFlYx1" %}
[Broken mention](broken://pages/-MUSA3fXQEXUc1CFlYx1)
{% endcontent-ref %}

{% content-ref url="/pages/-MUSAunBwe2J09CIl1hu" %}
[JMeter Test](/create-test/jmeter-test)
{% endcontent-ref %}

{% content-ref url="/pages/-MUT6iOSA6kWcHdMz1am" %}
[Features](/about-loadium/features)
{% endcontent-ref %}

{% content-ref url="/pages/-MUSDT9m95VYzdFJ536o" %}
[Sandbox](/test-settings/what-is-sandbox)
{% endcontent-ref %}

{% content-ref url="/pages/-MUT5hLDUtoTsSYDaFkV" %}
[Pricing OLD](/about-loadium/pricingold)
{% endcontent-ref %}

{% content-ref url="/pages/-MUSDlUqfBVdT1lh-1Bf" %}
[Dedicated IP old ui](/test-settings/what-is-dedicated-ip-old)
{% endcontent-ref %}

If you don't see the answer to your question here, please [reach out to us](https://loadium.com/contact-us/) to let us know! We're always improving our documentation.


# Network Type

What is , How to Use & Things to Pay Attention

Many people nowadays connect to the internet with their cell phones. Due to this, load from mobile sites has increased and the performance of mobile sites has also increased depending on the fluctuations in the networks.&#x20;

Mobile device users access the internet through their own networks. Therefore, internet speeds will vary depending on their location. Sometimes, users have problems accessing web applications from their mobile devices. One of the reasons for this is the different network bandwidths.&#x20;

### What is Bandwidth?

Bandwidth refers to Data Traffic, Data Transfer Speed and Bandwidth can be defined as the instant capacity of your internet connection. Bandwidth is the measurement of data capacity in communication sources in byte/second or bit/second.&#x20;

### Network Type With Loadium&#x20;

We need to make sure that websites or mobile applications work on every condition without affecting the user experience with functional and non-functional aspects in different internet connection speeds.&#x20;

You can select multiple network types on Loadium.  First you have to create a new Test.&#x20;

<figure><img src="/files/rxRXRnH0MZGkt0r8WI7d" alt=""><figcaption></figcaption></figure>

So you can create a realistic load with the different type of bandwidth usage. Don’t forget that this kind of configurations is very useful when it comes to testing Black Friday, Cyber Monday scenarios.&#x20;

<figure><img src="/files/weHDYK63sjpRI89nI4O6" alt=""><figcaption></figcaption></figure>

Cps(characters per second) values vary according to speed&#x20;

| Network Type   | Speed       | CPS      |
| -------------- | ----------- | -------- |
| Fast Ethernet  | 100 Mbit/s  | 12800000 |
| WIFI 802.11a/g | 54 Mbit/s   | 6912000  |
| ADSL2+         | 24 Mbit/s   | 3072000  |
| HSPA+          | 21 Mbp/s    | 2688000  |
| HSPA           | 14 Mbp/s    | 1843200  |
| ADSL2          | 12 Mbit/s   | 1536000  |
| Ethernet LAN   | 10 Mbit/s   | 1280000  |
| ADSL           | 8 Mbit/s    | 1024000  |

Enjoy load testing!

{% content-ref url="/pages/-MUSAunBwe2J09CIl1hu" %}
[JMeter Test](/create-test/jmeter-test)
{% endcontent-ref %}

{% content-ref url="/pages/-MUT6iOSA6kWcHdMz1am" %}
[Features](/about-loadium/features)
{% endcontent-ref %}

{% content-ref url="/pages/-MUSDT9m95VYzdFJ536o" %}
[Sandbox](/test-settings/what-is-sandbox)
{% endcontent-ref %}

{% content-ref url="/pages/-MUT5hLDUtoTsSYDaFkV" %}
[Pricing OLD](/about-loadium/pricingold)
{% endcontent-ref %}

{% content-ref url="/pages/2PGklWpGiOiqwXOfu1Eg" %}
[Dedicated IP](/test-settings/what-is-dedicated-ip)
{% endcontent-ref %}

If you don't see the answer to your question here, please [reach out to us](https://loadium.com/contact-us/) to let us know! We're always improving our documentation.


# Test Scheduling old

Brief guide on how to schedule your tests

\
When it comes to test planning, test scheduling is one of the key items. It’s also important for [creating a robust test plan](https://loadium.com/blog/part-1-how-to-create-a-robust-test-plan) suitable for the Software Testing Life Cycle (STLC).<br>

Thanks to Loadium, you can easily create a test schedule for your tests in a few steps. In this article, you will learn how to create test schedule for your tests.<br>

1. In the test creating page (also in the test editing page) click on “Scheduling” tab.

<figure><img src="/files/1hm1rZ1J41qswFzgpEOH" alt=""><figcaption><p>How to start test scheduling</p></figcaption></figure>

2. You can view the current scheduling plans of your test on Scheduling tab. Let’s click on “Add New Schedule” button to create a new scheduling plan.

<figure><img src="/files/wLaPRZ0ZDQstMuqcWwHg" alt=""><figcaption></figcaption></figure>

On this screen, you can create a daily, weekly, monthly and custom schedule for your test.

3. In the “Daily” tab, you need to select the start time for your schedule. Also, you can select End Date for your schedule to end it in specific date.

<figure><img src="/files/VuTtXLVNWcIAJpC0gtCp" alt=""><figcaption><p>Daily Test Scheduling</p></figcaption></figure>

4. In the “Weekly” tab, you need to select the days and time you want to run your test.

<figure><img src="/files/flOFtRUdWR4iNOVewkxq" alt=""><figcaption><p>Weekly Test Scheduling</p></figcaption></figure>

5. In the "Monthly" tab, you can choose which days of the month you want to run your test.

<figure><img src="/files/WuHYkO2x1dKUb94maAkB" alt=""><figcaption><p>Monthly Test Scheduling</p></figcaption></figure>

6. You can create custom schedules by using Cron Expression.

<figure><img src="/files/ikA5A3PR77CI5ojrpOAl" alt=""><figcaption><p>Custom Test Scheduling</p></figcaption></figure>

7. Once you created the test schedule, you can enable, disable and delete the schedules you want.

<figure><img src="/files/CvuisSRZk3b5ZPzl5A0P" alt=""><figcaption><p>Editting Schedules</p></figcaption></figure>

If you have further questions on test scheduling or any other features of Loadium, we are here to assist you. Contact us [here](https://loadium.com/contact-us)!

Happy Load Testing!


# Test Scheduling

Brief guide on how to schedule your tests

\
When it comes to test planning, test scheduling is one of the key items. It’s also important for [creating a robust test plan](https://loadium.com/blog/part-1-how-to-create-a-robust-test-plan) suitable for the Software Testing Life Cycle (STLC).<br>

Thanks to Loadium, you can easily create a test schedule for your tests in a few steps. In this article, you will learn how to create test schedule for your tests.<br>

1. In the test creating page (also in the test editing page) click on “Scheduling” tab.

<figure><img src="/files/ELYDAtwkcj70MN6QBiD7" alt=""><figcaption></figcaption></figure>

1. You can view the current scheduling plans of your test on Scheduling tab. Let’s click on “Add New Schedule” button to create a new scheduling plan.

<figure><img src="/files/unE6cCAtlplDEdbUhBAj" alt=""><figcaption><p>Test Scheduling</p></figcaption></figure>

On this screen, you can create a daily, weekly, monthly and custom schedule for your test.

4. In the “Weekly” tab, you need to select the days and time you want to run your test.

<figure><img src="/files/si4r5rl0RC1zGK4j6uxC" alt=""><figcaption><p>Weekly/Daily Test Schedule</p></figcaption></figure>

4. In the "Monthly" tab, you can choose which days of the month you want to run your test.

<figure><img src="/files/gzkiDLfojPWP8XzNz043" alt=""><figcaption><p>Monthly Test Schedule</p></figcaption></figure>

4. You can create custom schedules by using Cron Expression.

<figure><img src="/files/3LjAAIEQkbNiVaJllrbz" alt=""><figcaption><p>Custom Test Schedule with Cron Expression</p></figcaption></figure>

4. Once you created the test schedule, you can enable, disable and delete the schedules you want.

<figure><img src="/files/z6eOJG0N41E7bIWnyvnx" alt=""><figcaption><p>Editing Schedules</p></figcaption></figure>

If you have further questions on test scheduling or any other features of Loadium, we are here to assist you. Contact us [here](https://loadium.com/contact-us)!

Happy Load Testing!


# Test Failure Settings

What is , How to Use & Things to Pay Attention

The Failure Criteria feature allows you to set your test's pass/fail criteria for various metrics, such as response time, errors, hits/s, latency, bandwidth, throughput etc.

## How To Use

During creating or editing a test, you will find the Test Failure Settings tab.

![](/files/CknC2A2LDgqTZfNifjwQ)

After clicking the “+” icon, the following screen will appear.

![](/files/4Xr1A5vqKguIxboqqcTN)

* **Label** - Specify here if you want to use this rule on a particular label from your script.  It's set to "ALL" (all labels) by default.
* **Key Performance Indicator** - Select the specific metric you'd like to apply a rule for. Click the down arrow on the right side of the field to open a drop-down menu and review available metrics to monitor.
* **Condition** - The binary comparison operators for this rule, include; "Less than", "Greater than", "Equal to", and "Not Equal to".  Click the down arrow on the right side of the field to open a drop-down menu.
* **Threshold** - The numeric value you want this rule to apply to.
* **Stop Test** - If this box is checked, the test will stop immediately when that criteria fails; otherwise, it will continue running uninterrupted.

### Example

Stop testing if the hits.count of all labels is greater than 3.

![](/files/jOFSXLz8u5oDbwudxukL)

After saving the Failure Criteria, let's start the test and see the results. The test was stopped because the hits.count of all labels exceeded 3.

![](/files/-M_tMjBXfJ27c4X_-lVC)

On the report screen, we can see the results in the Failure Criteria field.

![](/files/-M_tMxg1FGcWmX7avbL6)

Enjoy load testing!

{% content-ref url="/pages/-MUSAoEB7WKUP6OKgxHU" %}
[Quick Start](/creating-your-first-test)
{% endcontent-ref %}

{% content-ref url="/pages/-MUSAunBwe2J09CIl1hu" %}
[JMeter Test](/create-test/jmeter-test)
{% endcontent-ref %}

{% content-ref url="/pages/-MUSDlUqfBVdT1lh-1Bf" %}
[Dedicated IP old ui](/test-settings/what-is-dedicated-ip-old)
{% endcontent-ref %}

{% content-ref url="/pages/-MUSF4HtwcKhwIZM3EdC" %}
[Understanding Test Reports](/create-test/understansing-test-reports)
{% endcontent-ref %}

{% content-ref url="/pages/-MUT64e7K16MOCUe5UD3" %}
[VUH - Virtual User Hour](/about-loadium/vuh-virtual-user-hour)
{% endcontent-ref %}

{% content-ref url="/pages/-MUT6iOSA6kWcHdMz1am" %}
[Features](/about-loadium/features)
{% endcontent-ref %}

If you don't see the answer to your question here, please [reach out to us](https://loadium.com/contact-us/) to let us know! We're always improving our documentation.


# JMeter Settings OLD

Brief guide for JMeter Settings while creating JMeter Tests

When a JMeter script is executed, execution is done with some predefined configurations. You can use Advanced Settings Panel to override those configurations, which will change the default values set within `jmeter.properties` file. Furthermore, you can also define variables and change their values using these settings.

<figure><img src="/files/6xjIxGc4To7lOg3A4gFz" alt=""><figcaption></figcaption></figure>

## Variable Referencing

You can create references to your variables within your JMeter script. This allows you to easily manage your variables within the script, without needing re-upload the script everytime you want to make changes.

**1)**&#x59;ou can enter the reference name on the left column (var1), and enter the value on the right column (aaa):

![](/files/UreZGIsUh6WhuqANw0fW)

**2)** Then you can capture the reference by using the annotation `${__P(var1)}`:

![](/files/E51rX1zPiJCXlHWJxI2r)

**3)** The given value in the right column will be used within the script.

Example result in the report page: ![](/files/jFwcffXURp1v1f7qAEYT)

{% hint style="info" %}
**Example Use Case:** Setting the target URL address as a variable (for test environment for example), and then changing that URL address by using Advanced Settings Panel.
{% endhint %}

{% hint style="info" %}
🙌🏻**Example:** If you want to change that JTL to save response headers, you need to set *JMeter.save.saveservice.responseHeaders* to true
{% endhint %}

You can also add additional command line parameters to your execution.&#x20;

Every JMeter script creates a JTL file after its execution. That JTL files content is defined by JMeter.properties file and Loadium always executes the default one. You can change the JTL file’s content by using this option.

{% hint style="warning" %}
**Note:** Those values must be carefully selected as they might corrupt the test and its results.
{% endhint %}


# JMeter Settings

Brief guide for JMeter Settings while creating JMeter Tests

When a JMeter script is executed, execution is done with some predefined configurations. You can use Advanced Settings Panel to override those configurations, which will change the default values set within `jmeter.properties` file. Furthermore, you can also define variables and change their values using these settings.

<figure><img src="/files/HfsgGRYCtYvDxEW3NA28" alt=""><figcaption></figcaption></figure>

## Variable Referencing

You can create references to your variables within your JMeter script. This allows you to easily manage your variables within the script, without needing re-upload the script everytime you want to make changes.

**1)**&#x59;ou can enter the reference name on the left column (var1), and enter the value on the right column (aaa):

<figure><img src="/files/XPrF2Z6ngVb0T8DwptwN" alt=""><figcaption></figcaption></figure>

**2)** Then you can capture the reference by using the annotation `${__P(var1)}`:

![](/files/E51rX1zPiJCXlHWJxI2r)

**3)** The given value in the right column will be used within the script.

Example result in the report page: ![](/files/jFwcffXURp1v1f7qAEYT)

{% hint style="info" %}
**Example Use Case:** Setting the target URL address as a variable (for test environment for example), and then changing that URL address by using Advanced Settings Panel.
{% endhint %}

{% hint style="info" %}
🙌🏻**Example:** If you want to change that JTL to save response headers, you need to set *JMeter.save.saveservice.responseHeaders* to true
{% endhint %}

You can also add additional command line parameters to your execution.&#x20;

Every JMeter script creates a JTL file after its execution. That JTL files content is defined by JMeter.properties file and Loadium always executes the default one. You can change the JTL file’s content by using this option.

{% hint style="warning" %}
**Note:** Those values must be carefully selected as they might corrupt the test and its results.
{% endhint %}


# Failure Criteria old

Brief guide for Failure Criteria

### Test Failure Settings

Loadium allows you to define a set of rules to track certain conditions, or even automatically stop the test if the condition is met. You can find more detailed information about Test Failure Settings [here](https://wiki.loadium.com/test-settings/test-failure-settings).

![](/files/-M_Qs30nDb-PSiBsZMtY)

Happy testing!


# Failure Criteria

Brief guide for Failure Criteria

### Test Failure Settings

Loadium allows you to define a set of rules to track certain conditions, or even automatically stop the test if the condition is met. You can find more detailed information about Test Failure Settings [here](https://wiki.loadium.com/test-settings/test-failure-settings).

<figure><img src="/files/bmSLWCipiWJPbS51YrUf" alt=""><figcaption></figcaption></figure>

If you tick Ignore During Ramp-up, threshold will be ignored until the ramp-up period is finished (instead of the first minute)

Happy testing!


# Flexible Thread Scheduling

A guide for Flexible Thread in JMeter

There is a plug-in for JMeter that we can use to increase or decrease the number of threads at a scheduled time in JMeter tests.

The Ultimate Thread Group provides flexible thread scheduling to your test scenario. It allows you to create a scheduled thread with advanced configuration.

Available scenarios with the Ultimate Thread Group are as following:

* Multiple scheduled records can be defined
* Start Threads Count, Initial Delay, Startup Time and Hold Load Time can be defined separately for each record
* Scheduled load preview can be displayed on the chart

### **Step 1: Add Thread Group**

Test plan -> Add -> Threads (Users) -> jp\@gc – Ultimate Thread Group

![](https://loadium.com/wp-content/uploads/2020/04/Picture1.png)

#### 🙌🏻  **Example:**

* The test will start with 70 threads
* At the 20th second of the test, 200 threads will be reached by adding 130 threads with a 4 second ramp up.
* After working with 200 threads for 25 seconds, 130 threads will be closed.
* In the 60th second of the test, 150 threads will be reached by adding 80 threads with a 4 second ramp up.
* After working with 150 threads for 25 seconds, 80 threads will be closed.
* Continue with 70 threads until 2 minutes are completed.

![](https://loadium.com/wp-content/uploads/2020/04/Picture2.png)

To make it more understandable, we have marked the area that each record covers on the chart.

**Note**: *Threads are automatically closed when the given hold load time is complete. If there are threads that are not closed, there are thread blocking operations.*

### **Step 2: Basic Settings**

Required configurations on the “New Tests” screen for the JMeter test scenario using ultimate thread group:

* **Thread Count** value should be calculated and entered at the maximum thread number that will run simultaneously. For example: In the example above, max 200 threads will work in one engine at the same time.
* **Duration** value should be set according to the timeline in the ultimate thread group preview graphic. It’s not a problem that the time determined is more than the ultimate thread running time. Testing will end automatically when threads are finished.
* **Iteration** and **Ramp up Time** values are managed by the Ultimate thread group plug-in.
* The **Engine Count** value should be set accordingly as many as the number of engines requested.

#### ![](https://loadium.com/wp-content/uploads/2020/04/Picture3.png)

Thread group values in the Ultimate thread group are not updated with the interface. You must do the necessary thread group config in jmx. You can save and run the test.

Report resulting from the above test:

![](https://loadium.com/wp-content/uploads/2020/04/Screen-Shot-2020-04-24-at-18.22.47.png)

Enjoy load testing!

{% content-ref url="/pages/-MUSAunBwe2J09CIl1hu" %}
[JMeter Test](/create-test/jmeter-test)
{% endcontent-ref %}

{% content-ref url="/pages/-MUSDT9m95VYzdFJ536o" %}
[Sandbox](/test-settings/what-is-sandbox)
{% endcontent-ref %}

{% content-ref url="/pages/-MUSDlUqfBVdT1lh-1Bf" %}
[Dedicated IP old ui](/test-settings/what-is-dedicated-ip-old)
{% endcontent-ref %}

If you don't see the answer to your question here, please [reach out to us](https://loadium.com/contact-us/) to let us know! We're always improving our documentation.


# File Output

A quick guide to output custom files from your test runs

Loadium allows you to generate custom files, download and access them in your JMeter tests using its "Custom Logging" feature.

<figure><img src="/files/hZM7PXjYRdAVxXsny2eK" alt=""><figcaption></figcaption></figure>

You can use custom libraries (such as java.io.File) to generate files.

For example, we have a Groovy script for creating a `.txt` file for logging, as shown below:

<figure><img src="/files/X8o11lKNrabJuw9fY7gq" alt=""><figcaption></figcaption></figure>

{% hint style="info" %}
**Note: As mentioned above, output path of your custom file must be set as "useroutput/myFileName" in order to access your file.**
{% endhint %}

Run the test for which you want to get the file outputs and wait for the test to finish. To verify that your file has been successfully written, check the **JMeter.log** window in the **Logs** tab.

<figure><img src="/files/ENcL2XflufmmrYhMG6re" alt=""><figcaption></figcaption></figure>

Once your test is finished, go to the **Logs** tab on the test report page and click the "Download Main Folder" button to download your main test folder.

<figure><img src="/files/NkmNLTiSRtI0vXaAJ025" alt=""><figcaption></figcaption></figure>

Now you can access the output files of your test simply by unzipping specified output file.

<figure><img src="/files/uhKhGvF02NGiRTIgFgN4" alt=""><figcaption></figcaption></figure>


# Azure DevOps Pipeline

A guide for Loadium’ s Azure DevOps Integration

Loadium can be executed via Azure DevOps Pipelines using the [Loadium Azure Pipeline Extension.](https://marketplace.visualstudio.com/items?itemName=Loadium.loadium-integrations)

### Installation

1. Go to link and Click “Get It Free” to install Loadium Extension.

![](/files/rLXQ7VxujAZ2ZLf34d3H)

2\. Login to Azure DevOps Platform.

3\. Select your project.

4\. Navigate to **Pipelines -> Releases**

![](/files/BMtI20J6dbKDVPzntvwc)

Click on “New” and select “New Release Pipeline”.

![](/files/bvxETn6S28uUzcbndJsf)

5\. On the “Select a template” screen, start with an “Empty Job” on the right top of the screen.

![](/files/Kkdn3L5cMGumvtN2VljW)

6\. Navigate to “Tasks” page.

![](/files/qf1S2XixwgwdsrYqTpMM)

7\. Click on “ + “ button to Add a task to Agent Job.

![](/files/sfFnTIgSchiFXSQhiUCM)

### How do I Configure Loadium Extension to Start Testing with Loadium?

1\. Follow the steps mentioned in the above section to install the Loadium Azure DevOps extension. If already done, please proceed to Step 2.

2\. On the **Add tasks** screen, search for Loadium and click the **Add** button.

3\. Enter **Test URL.** For the Test URL, login to the Loadium account. Click on the **Account Page.** Go to the API KEY tab.

4.Click “ Create Role “ to create a role.

![](/files/ctYKSIU7kryJHnUrtkU6)

**\*\*You have to add TEST\_START role to start test on Loadium.**

5\. Click to button ‘Create Api Key’.

![](/files/D1ndKdpU7cvzdUZQXFX3)

6\. Copy Access Key and Secret Key to Extension

![](/files/iWVSPsQXAqlsjchqFUzg)

7\. Click on the link of the test key you want and copy the URL after the **“ detail/** “ and paste Extension.

![](/files/1vcb0qoFXbjB1S1L5HGo)

8\. Save the Extension.

![](/files/Q0E4eDkzBFri1mk2cMmB)

9.Run the pipeline and you will see in the Job.

![](/files/DeNCWfRFTiz22bbKAXAM)

If you have further questions, do not hesitate to contact Loadium Technical Support Team over chatbot.&#x20;

Happy Load Testing!


# Jenkins Load Testing with Loadium

Integration and more

### What is Jenkins?

[Jenkins](https://jenkins.io/) is an open source web based continuous integration tool. It support operation like triggering automated tests, starting a build or making a commit to a version control system.

You can install Loadium’s Jenkins plugin from Jenkins market place. You need to navigate “**Manage Jenkins**” menu then “**Manage Plugins**“.  You need to search **Loadium** keyword in the **Available** tab.

After the installation, you need to add your Loadium credentials inside Jenkins.

### **How to Add Loadium Credentials to Jenkins**

* Open the Credentials menu in Jenkins’ welcome screen
* Navigate to “Global” credentials in that screen
* Select “Add Credential” link

Credentials page will ask you to fill some fields.

![](https://loadium.com/wp-content/uploads/2018/01/credentials-600x189.png)

* **ID:** Choose something differentiating than the other credentials stored in Jenkins
* **Description:** Description of the plugin, you can give anything
* **Username:** Your Loadium account’s username
* **Password:** Your Loadium account’s password

Fill out those fields and click Test Connection button to validate your credentials. In case it’s a success, you’ll receive “**Connection to Loadium Server is succesfull**” message. If not, you’ll be warned with an error message.

### **How to Add Loadium Plugin to Your CI Pipeline**

* Navigate to an Item in Jenkins main page to enable Loadium’s plugin.
* In Build Step, you’ll see “**Loadium Performance Test Runner Plugin**” option.
* Choose this one.

![](https://loadium.com/wp-content/uploads/2018/01/plugin-jenkins-600x144.png)

* Choose the credential that you created previously.
* Then plugin will fetch the projects you created in Loadium and fill “Loadium Test” combobox.
* Select the desired test to run and save your Jenkins Item.

Right now, you will be able to run any performance test in Loadium in your CI/CD pipeline.

Enjoy load testing!

{% content-ref url="/pages/-MUT6iOSA6kWcHdMz1am" %}
[Features](/about-loadium/features)
{% endcontent-ref %}

{% content-ref url="/pages/-MUSA3fXQEXUc1CFlYx1" %}
[Broken mention](broken://pages/-MUSA3fXQEXUc1CFlYx1)
{% endcontent-ref %}

{% content-ref url="/pages/-MUSA62srAvcUJsdKFVu" %}
[Broken mention](broken://pages/-MUSA62srAvcUJsdKFVu)
{% endcontent-ref %}

{% content-ref url="/pages/-MUSAoEB7WKUP6OKgxHU" %}
[Quick Start](/creating-your-first-test)
{% endcontent-ref %}

{% content-ref url="/pages/-MUSAunBwe2J09CIl1hu" %}
[JMeter Test](/create-test/jmeter-test)
{% endcontent-ref %}

{% content-ref url="/pages/-MUT5hLDUtoTsSYDaFkV" %}
[Pricing OLD](/about-loadium/pricingold)
{% endcontent-ref %}

If you don't see the answer to your question here, please [reach out to us](https://loadium.com/contact-us/) to let us know! We're always improving our documentation.


# Microsoft Teams Integration old

## Overview

Microsoft Teams integration allows you to receive real-time notifications about various Loadium events directly in your Teams channels. This integration helps teams stay informed about important test activities and system events without leaving their communication platform.

## Setting Up Teams Webhook

### 1. Choose Teams Channel:

* Open the New Microsoft Teams client
* Select "Teams" from the left sidebar
* Locate your desired channel
* Click "•••" (More options) next to the channel name
* Select "Manage channel"

### 2. Configure Webhook:

* Select "Edit connectors"
* Find and configure "Incoming Webhooks"
* Add the webhook to your channel (or configure if already exists)
* Copy the generated webhook URL to use in Loadium

For detailed information about Teams webhook setup, refer to [Microsoft Teams official documentation](https://learn.microsoft.com/en-us/microsoftteams/platform/webhooks-and-connectors/how-to/add-incoming-webhook?tabs=newteams%2Cdotnet).

{% hint style="info" %}
**Note:** The setup process may vary slightly based on your Teams version and permissions. If you encounter any issues, please consult your Teams administrator or the Microsoft documentation.
{% endhint %}

### 3. Connect to Loadium:

In Loadium, navigate to **Account** -> **Integrations** -> **Communication**

Click the "+" button under Teams card

Enter a Profile Name for your integration

Paste the Microsoft Teams Webhook URL from your Teams channel.

<figure><img src="/files/lquEZunetnx9BsiAmKoV" alt="" width="375"><figcaption></figcaption></figure>

## Notification Events

You can configure the following event types for notifications:

* **User Added:** Receive notifications when new users are added to your Loadium account
* **Test Run Started:** Get notified when a load test begins execution
* **Test Run Completed:** Receive alerts when a load test finishes
* **Usage Limit Nearing:** Get warnings when you're approaching your usage limits
* **Dedicated IPs Expiring:** Receive notifications about soon-to-expire dedicated IP addresses

{% hint style="info" %}
**Important:** By default, webhook channel notifications may be silenced intermittently. To ensure you receive timely updates, please follow these steps to enable the appropriate notification settings
{% endhint %}


# Microsoft Teams Integration

## Overview

Microsoft Teams integration allows you to receive real-time notifications about various Loadium events directly in your Teams channels. This integration helps teams stay informed about important test activities and system events without leaving their communication platform.

## Setting Up Teams Webhook

### 1. Choose Teams Channel:

* Open the New Microsoft Teams client
* Select "Teams" from the left sidebar
* Locate your desired channel
* Click "•••" (More options) next to the channel name
* Select "Manage channel"

### 2. Configure Webhook:

* Select "Edit connectors"
* Find and configure "Incoming Webhooks"
* Add the webhook to your channel (or configure if already exists)
* Copy the generated webhook URL to use in Loadium

For detailed information about Teams webhook setup, refer to [Microsoft Teams official documentation](https://learn.microsoft.com/en-us/microsoftteams/platform/webhooks-and-connectors/how-to/add-incoming-webhook?tabs=newteams%2Cdotnet).

{% hint style="info" %}
**Note:** The setup process may vary slightly based on your Teams version and permissions. If you encounter any issues, please consult your Teams administrator or the Microsoft documentation.
{% endhint %}

### 3. Connect to Loadium:

In Loadium, navigate to **Account** -> **Integrations** -> **Communication**

Click the "+" button under Teams card

Enter a Profile Name for your integration

Paste the Microsoft Teams Webhook URL from your Teams channel.

<figure><img src="/files/2L2N6i45346Rbayu8Yp7" alt=""><figcaption></figcaption></figure>

## Notification Events

You can configure the following event types for notifications:

* **User Added:** Receive notifications when new users are added to your Loadium account
* **Test Run Started:** Get notified when a load test begins execution
* **Test Run Completed:** Receive alerts when a load test finishes
* **Usage Limit Nearing:** Get warnings when you're approaching your usage limits
* **Dedicated IPs Expiring:** Receive notifications about soon-to-expire dedicated IP addresses

{% hint style="info" %}
**Important:** By default, webhook channel notifications may be silenced intermittently. To ensure you receive timely updates, please follow these steps to enable the appropriate notification settings
{% endhint %}


# New Relic Integration

A guide for Loadium’ s New Relic Integration

New Relic is a company which  offers performance management solutions, enabling developers to realize and fix problems in real time. With this development, through New Relic integration, developers can easily monitor their application performance while load testing it. It also allows developers to evaluate the end-user experience and the application system KPI using single dashboard.

Now, you can diagnose performance related problem, apply a fix and repeat this cycle with ease. This data also accessible even after the test has ended.

## Setting Up Loadium New Relic Integration

### Creating Profile

* While **creating a new test** or **editing an existing one**, you’ll find New Relic option under APM Integration tab.

![](/files/-MaCr560S-Hcy19aWSj0)

{% hint style="info" %}
**Note** : Filling all the fields under ‘Basic Settings’ Tab is needed to run test after APM integration.
{% endhint %}

* To create a new profile or to choose already existing profile, click **New Relic APM** button then click '**Create a new New Relic Profile'** button to create new one and paste your New Relic data sharing API Key into the relevant field also give it a title for future reference. Then click next.

![](/files/-MaCrGC_xgD2zfi9z0n-)

![](/files/-MaD_wMCMXl4GdEUXDrv)

* There are 2 options for entity type.&#x20;
  * Applications are for built-in functions\&metrics of New Relic
  * Components are for custom-made functions\&metrics

![](/files/-MaCrZyOkbG2ONubxPUT)

* And you need to choose 'Entities' and 'Metrics' that you already added to your New Relic account.&#x20;

![](/files/-MaD2x_sppBoqYw740Dj)

* After filling all desired fields, you can show summary of your New Relic APM integration. Later, we can see integrated APM under the Integrated APM’s section.

![](/files/-MaD_FG3nKCCeL0ABw4Q)

### Managing Profiles

![](/files/-MaD4HdbQ267taSXe1f2)

* '1' numbered area shows us the integrated APMs under the Integrated APM’s section.
* '2' numbered button is necessary to assign this APM to the test which you already arranged. After clicking ‘Save Test’ you can now start the test.
* '3' numbered button is useful for removing any new relic from selected test.

{% hint style="info" %}
**Note:** There are 2 different ways to delete APM;

* First one is removing the New Relic from the test.
* Second one is deleting this New Relic globally.
  {% endhint %}

![](/files/-MaD5-wKUcRDFRPIrZdt)

* '4' numbered button is for Edit or Delete APM globally. With this option, we can either edit the name and API Key or delete the new relic globally.

![](/files/-MaD5hpFrCsjUqfeMjVp)

* '5' numbered button  we can edit both New Relic API Key and Selected Metrics.

## Usage During Test

Afterwards, Run Test will direct you to report page. From the report page, you can go to New Relic tab from the left-side menu as shown.

![](/files/-MaD7zoQqjVAWXi47mXa)

At this page we can see our entity types and metrics that we selected previously. And by clicking the checkbox near by metrics, we can start monitoring the data graphically.

![](/files/-MaDLtCyh2ZDpqFodSrO)

Happy testing!

{% content-ref url="/pages/-MUQ5cTQeTV9Yioro2zC" %}
[Getting Started with Loadium](/getting-started)
{% endcontent-ref %}

{% content-ref url="/pages/-MUSA3fXQEXUc1CFlYx1" %}
[Broken mention](broken://pages/-MUSA3fXQEXUc1CFlYx1)
{% endcontent-ref %}

{% content-ref url="/pages/-MUSAoEB7WKUP6OKgxHU" %}
[Quick Start](/creating-your-first-test)
{% endcontent-ref %}

{% content-ref url="/pages/-MUSA62srAvcUJsdKFVu" %}
[Broken mention](broken://pages/-MUSA62srAvcUJsdKFVu)
{% endcontent-ref %}

{% content-ref url="/pages/-MUSDT9m95VYzdFJ536o" %}
[Sandbox](/test-settings/what-is-sandbox)
{% endcontent-ref %}

If you don't see the answer to your question here, please [reach out to us](https://loadium.com/contact-us/) to let us know! We're always improving our documentation.


# AppDynamics Integration

A guide for Loadium’ s AppDynamics Integration

AppDynamics is a software analytics company which offers performance management solutions enabling developers to diagnose and fix application performance problems in real time.

Using Loadium’s integration with AppDynamics, developers can easily monitor their application performance levels while load testing it. Loadium users can now easily incorporate key performance metrics from AppDynamics into their test scenarios to more quickly identify hot spots in the system under test.&#x20;

Not only are you able to view your application monitoring data alongside your user-experience and performance data, but this data is accessible for you even after the test has ended.

## **Setting Up Loadium App Dynamics Integration**

### **Creating Profile**

While **creating a new test** or **editing an existing one**, you’ll find AppDynamics option under APM Integration tab.

![](/files/-MaDNL8Xzwrr9GVAFZvJ)

{% hint style="info" %}
**Note** : Filling all the fields under 'Basic Settings' Tab is needed to run test after APM integration.
{% endhint %}

Button number '2' allows you to select an existing profile or create new one.

![](/files/-MaCbNeTBAF4N8NDNsCJ)

If you need a new App Dynamics profile, first, you will have to integrate your AppDynamics account's details by entering the required details.

![](/files/-MaCbUQcNtCOplcpUvUo)

Second, you can select proper metrics.

![](/files/-MaCbti8O5nhwe-p9f49)

## Usage During Test

Afterwards, Run Test will direct you to report page. From the report page you can go to App Dynamics tab as shown.

![](/files/-MaDODEPe2LUApaFuaZZ)

At this page we can see our metrics that we selected previously. By clicking the checkbox near by metrics, we can start monitoring the data graphically.

Enjoy testing!

{% content-ref url="/pages/-MUSAoEB7WKUP6OKgxHU" %}
[Quick Start](/creating-your-first-test)
{% endcontent-ref %}

{% content-ref url="/pages/-MUSAunBwe2J09CIl1hu" %}
[JMeter Test](/create-test/jmeter-test)
{% endcontent-ref %}

If you don't see the answer to your question here, please [reach out to us](https://loadium.com/contact-us/) to let us know! We're always improving our documentation.


# TeamCity Integration

### What is TeamCity?

TeamCity is a Java-based build management and continuous integration server from JetBrains. You can use TeamCity to trigger your Load Testing process by using Loadium’s plugin.

### **Installation Steps**

* You can install Loadium’s TeamCity plugin from Jetbrains market place. Follow this [link](https://plugins.jetbrains.com/plugin/10487-loadium-jmeter-runner) to download plugin.
* After downloading Loadium’s plugin zip file, open your TeamCity administration panel. Go to “Plugin List” menu and install downloaded plugin by uploading it into your TeamCity server.

![](https://loadium.com/wp-content/uploads/2018/03/Screen-Shot-2018-04-09-at-12.09.08-600x328.png)

### How to Use Integration?

* There’s an Integration section under Administration page. You’ll find Loadium under it after a successful installation. Select Loadium plugin.
* Enter your Loadium credentials and save them. Click “Test Connection” button to validate your credentials.

![](https://loadium.com/wp-content/uploads/2018/03/Screen-Shot-2018-04-09-at-12.09.20-600x260.png)

* Go to the project’s “Build Settings” where you want to execute performance test. Add a  new Build Step. Choose Loadium as Runner Type. You can give a free text as step name.
* In case your credentials are ok, your Loadium project will be loaded under “Loadium Test List” combobox.
* Click Save to save your Build Step.

![](https://loadium.com/wp-content/uploads/2018/03/select-project-600x344.png)

* Run your test and see the test runs like a charm. You can take a logs if you want and watch the execution status.

![](https://loadium.com/wp-content/uploads/2018/03/test-run-600x246.png)

Enjoy testing!

{% content-ref url="/pages/-MUT6iOSA6kWcHdMz1am" %}
[Features](/about-loadium/features)
{% endcontent-ref %}

{% content-ref url="/pages/-MUQ5cTQeTV9Yioro2zC" %}
[Getting Started with Loadium](/getting-started)
{% endcontent-ref %}

{% content-ref url="/pages/MgN0OAuKVZtI6DuNx1bd" %}
[Pricing](/about-loadium/pricing)
{% endcontent-ref %}

{% content-ref url="/pages/-MdzgKH5SWu9wNDRJLcG" %}
[Gatling Corner](/gatling-corner/introduction-to-gatling-old)
{% endcontent-ref %}

{% content-ref url="/pages/-MUSAunBwe2J09CIl1hu" %}
[JMeter Test](/create-test/jmeter-test)
{% endcontent-ref %}

{% content-ref url="/pages/uADtdH7q8HM7HPzTdDZC" %}
[Locust Test](/create-test/locust-test)
{% endcontent-ref %}

If you don't see the answer to your question here, please [reach out to us](https://loadium.com/contact-us/) to let us know! We're always improving our documentation.


# Built-in JMeter Functions

JMeter allows you to conduct [performance tests](https://loadium.com/blog/in-depth-analysis-throughput-controller-in-jmeter-and-splitting-threads-to-requests/) on your application by using any type of request. During these tests, we sometimes need to create new data, timestamp or maybe manipulate a response.

For these purposes, [JMeter](https://loadium.com/blog/handling-error-messages-of-jmeter-tests-in-loadium/) provides built-in functions easily adaptable to your tests. Let’s explore the ones that you might need during a test.

## Random String

In order to create a random string in [JMeter](https://loadium.com/blog/local-network-simulation-on-jmeter/) there are a few different ways.

Examples:

**${\_\_RandomString(5)}** This will create a random string, It can be readable or not.

**${\_\_RandomString(5,ABCD123)}** This will create a random string containing only the alphanumeric values that you provide.

**${\_\_RandomString(5,,var)}** This will create a random string, then assign the value to a variable. So you will be able to use that variable in another script by using ${var} expression. Second parameter for RandomString function is optional.

## Random Number

In order to create a random string in [JMeter](https://loadium.com/blog/jmeter-timers/) there are a few different ways.

Examples:

**${\_\_Random(5)}** This will create a random number with defined length.

**${\_\_Random(5,var)}** This will create a random number with defined length, then assign the value to a variable. So you will be able to use that variable in another script by using ${var} expression.

## UUID

A **universally unique identifier** (**UUID**) is a [128-bit](https://en.wikipedia.org/wiki/128-bit) number used to identify information in computer systems. In order to create one in JMeter, you should us \_\_UUID() functionality. UUID is almost unique as its length and random

**${UUID()}**  and you will have a value like that 0c7dba7e-7587-46d0-88f2-dfe577b88432

## Split String

In case you need to split a String with a delimiter, you can use ${SPLIT()} functionality.

Just create a BeanShell Processor where you would want the split operation to happen. Then add this **${\_\_split(${param},splitParam,|)}** in the beanshell script field.

1st Parameter: Parameter that you would want to split.

2nd Parameter: After the split, splitted values will be assigned to this variable. You need to define index when using it.

3rd Parameter: Delimiter that you have in the String.

Example:

Param = canberk|akduygu|loadium

splitParam\_1 = canberk

splitParam\_2 = akduygu

splitParam\_3 = loadium

## Time

You can use Time functionality to get current time with different formats. You can specify a date time format to format time value.

${\_\_time(dd/MM/yyyy,)} will get you 02/12/2018

${\_\_time(dd-mmm-yyyy hh:mm,)} will get you 02-12-2018 12:22

${\_\_time()} will get you the timestamp like 1598723200239

There are many other functions that you would use with [JMeter](https://loadium.com/blog/tag/jmeter/) but in case those functions are not sufficient for you, [JavaScript](https://loadium.com/blog/handling-error-messages-of-jmeter-tests-in-loadium/) is here to help you.

## JavaScript

You can use \_\_javaScript() function and pass any javascript code as a parameter and do extreme stuff also.

**Examples:**

Create a number between 0-10

**${\_\_javaScript(Math.floor(Math.random() \* 10))}**

Compare a variable to a hardcoded string then storing true/false result to a variable.

**${\_\_javaScript(“${username}”==”canberk”,found)}**


# How to Install JMeter Plugins

JMeter has many plugins that come in handy from time to time for either developing a script or viewing results. It is an easy and brief process to install and start using plugins in your script. Let's take a look.

## **JMeter Plugins Manager**

The first thing to start with is JMeter Plugins Manager, which helps you to install, upgrade and uninstall your Plugins without any confusing steps.

With the help of the [Plugins](https://loadium.com/blog/performance-test-with-selenium/) Manager, now you don’t have to install various plugins manually. The Plugins Manager does it itself without confusing you with installation files and etc.

### **How to install?**

1\) Download the [JMeter Plugins Manager](https://jmeter-plugins.org/install/Install/) JAR file and then put it into JMeter’s **lib/ext** directory.

2\) Start JMeter and go to “Options” menu to access the Plugins Manager.

![](/files/-McmnCci0uJwgESyRjQ7)

3\) And here it is, [JMeter](https://loadium.com/blog/handling-error-messages-of-jmeter-tests-in-loadium/) Plugins Manager. From this dialogue you may install, uninstall or upgrade your Plugins only by clicking the check-boxes. The plugins which need upgrades will appear in *italic* mode. If you are done with your install, uninstall or upgrade, you just need to click **Apply Changes and Restart JMeter**.

![](/files/-Mcmna_-daPjIGUx05wS)

If you want to use JMeter in command mode, you may want to check [here](https://loadium.com/blog/using-commandline-parameters-in-jmeter/).

Happy load testing!

{% content-ref url="/pages/-MUT6iOSA6kWcHdMz1am" %}
[Features](/about-loadium/features)
{% endcontent-ref %}

{% content-ref url="/pages/-MUQ5cTQeTV9Yioro2zC" %}
[Getting Started with Loadium](/getting-started)
{% endcontent-ref %}

{% content-ref url="/pages/-MUSAunBwe2J09CIl1hu" %}
[JMeter Test](/create-test/jmeter-test)
{% endcontent-ref %}

{% content-ref url="/pages/MgN0OAuKVZtI6DuNx1bd" %}
[Pricing](/about-loadium/pricing)
{% endcontent-ref %}

If you don't see the answer to your question here, please [reach out to us](https://loadium.com/contact-us/) to let us know! We're always improving our documentation.


# Record and Play Load Testing With Jmeter in 5 Steps

While Apache JMeter allows you to create a [load test from scratch](https://loadium.com/blog/introduction-to-jmeter/), it also gives you the opportunity to Record and Playback load test scenarios for your web or mobile applications. Recording [performance test](https://loadium.com/blog/is-your-business-ready-for-the-peak-season/) scenarios are very useful when it comes to web or mobile testing. Websites and mobile applications make many requests varying from initial server to 3rd party application like analytics sites etc. Therefore implementing those requests from scratch may not be the best idea. In those cases, we recommend you to use the Recording module of JMeter.

JMeter has a special module for that purpose. It’s called **HTTP Test Script Recorder**. This module works as a proxy on the host and port that you provide and listen to the [HTTP requests](https://loadium.com/blog/4-things-you-should-know-about-http-requests/). Then creates **HTTP Sampler** for recorded requests.

## How to Configure HTTP Test Script Recorder

### Step 1

Go to Non-Test Elements and select the module.

![](/files/-MciBjeJW2LgBAC38wT4)

In that screen, you will see many configuration elements. Some of them are mandatory, some are not.

{% hint style="info" %}
Port is mandatory. This port number will also be used in your browser. So select an empty port. [JMeter](https://loadium.com/blog/handling-error-messages-of-jmeter-tests-in-loadium/) proxy is not ready with basic configuration.
{% endhint %}

### Step 2

Others configuration items are optional. But there is on item, you should configure from our experience. That’s the **Grouping** section. During script recording, we’ll simulate an end to end test. Therefore many pages, many jpeg or CSS files will be captured. But we need to distinguish which request is made on which page or application module so that during execution, JMeter will create readable reports.

![](/files/-MciBxgfo0yuu-1dW7zm)

There are 5 choices:

![](/files/-MciC1kkLcUjUsS2MWO0)

* **1) Do not group sampler:** Don’t use this one for your sake. Every request will be listed on the same label and it’s not easy to distinguish which request belongs to which action you made during test recording.
* **2) Add a Separator Between Each Group:** A basic separator will be added between every action you made during recording.
* **3) Put Each group in a new Controller:** This will also record your test scenario according to your actions and create a [Controller](https://loadium.com/blog/module-controller/) for each action you made.
* **4) Put each group in a New Transaction Controller:** That’s basically the same as the 3rd option but there’s a slight difference. Transaction Controller lets you aggregate the results under one label. The [controller](https://loadium.com/blog/in-depth-analysis-throughput-controller-in-jmeter-and-splitting-threads-to-requests/) doesn’t.
* **5) Store 1st Sampler of each group only:** This one will save only the first request of every action you made. That might not be the best solution as we mostly want to capture all requests.

### Step 3

There is another config that you might want to do. That’s “Which file to be excluded during recording?”.

Add file extensions that you don’t want to capture to **URL Patterns to Exclude**.

Regular expression pattern is .\*\\.extensionName.\*

![](/files/-MciCC5My_QXUVMJIvJe)

The reason we do this is that those files are mostly dynamic and they are likely to change in near future. This about a newspaper website, images are changing every minute. So there’s no need to capture those things. We are able to call dynamic content by making a small configuration.

### Step 4

This configuration can be done by adding an [HTTP Request](https://loadium.com/blog/how-to-record-http-https-traffic-with-mitmproxy/) Defaults to your test plan.

Add an HTTP Request Default, then go to the Advanced tab. Select **Retrieve All Embedded Resources**

![](/files/-MciCHSxNRYpQdXnEJy4)

Now JMeter will always request the most updated embedded content for the pages that you visit. Think about creating a Random Product when clicking on an e-commerce web page. Every time we hit another product, [JMeter](https://loadium.com/blog/websocket-with-apache-jmeter/) will ask about the resource for those products when this is configured.

### Step **5**

Configure your browser’s proxy settings to JMeter’s setting that you made in step 1. Then hit the Start button in Test Script Recorder.

Now you can capture any request.

Happy [load testing](https://loadium.com/blog/5-steps-to-create-a-realistic-load-test/)!

{% content-ref url="/pages/-MUT6iOSA6kWcHdMz1am" %}
[Features](/about-loadium/features)
{% endcontent-ref %}

{% content-ref url="/pages/-MUQ5cTQeTV9Yioro2zC" %}
[Getting Started with Loadium](/getting-started)
{% endcontent-ref %}

{% content-ref url="/pages/-MUSAunBwe2J09CIl1hu" %}
[JMeter Test](/create-test/jmeter-test)
{% endcontent-ref %}

{% content-ref url="/pages/MgN0OAuKVZtI6DuNx1bd" %}
[Pricing](/about-loadium/pricing)
{% endcontent-ref %}


# Websocket with Apache JMeter

It’s apparent that the usage of Websocket has expanded greatly in recent years, and its reliability is expected to be high since it mostly carries crucial information to clients. Hence, [testing](https://loadium.com/blog/functional-testing-with-loadium-apache-jmeter/) their durability and reliability has become more important.

It is possible to execute [performance tests](https://loadium.com/blog/tag/performance-testing/) on Websockets with Apache [JMeter](https://loadium.com/blog/tag/jmeter/) by using “Websocket Samplers” plugin developed by Peter Doornbosch.

## **Websocket Samplers Plugin For Jmeter**

Let’s take a look at the [plugin](https://loadium.com/blog/how-to-install-use-jmeter-plugin/) first.&#x20;

You can download the plugin [here](https://jmeter-plugins.org/?search=websocket-samplers).

Once you install the plugin, you will get 7 new Sampler elements:

* **Websocket Close**: Closes the current Websocket connection
* **Websocket Open Connection:** Initiates a new connection with given parameters, with options for connection\&read timeouts
* **Websocket Ping/Pong:** Performs a ping or ping/pong service for the current connection
* **Websocket Sampler:** A single sampler that performs one-time request.
* **Websocket Single Read Sampler:** Reads response without sending a request.
* **Websocket Single Write Sampler:** Sends a request without reading the response
* **Websocket request-response Sampler:** Does both sending a request and reading response

## Example Case

Websockets’ behavior may reveal differences between each other, but the structure of a script for Websocket is usually similar to the following format:

* Initiating a connection with Websocket
* Sending the first request
* Receiving the first request
* Using a looper (Runtime controller or Loop Controller etc.) to continue the data transmission between the client and the server by sending a message and receiving it.

-First, we need to start a connection with the Websocket. It can be done either using “Websocket Open Connection”, or “Websocket Request” with the “setup new connection” option.

-The information about the sockets needs to be given. For example, you can find the socket’s information from Google Chrome’s Inspect mode>Network>WS

![](/files/-MchdOwi_wB2kG1rUy6D)

-There is one another situation that requires a token that is received by another request for a Websocket to initiate a connection.

![](/files/-McheVcMhdAL5dGW-sf9)

-When the connection has started, there will be a series of messages that will be transferred from both the client and the server-side. Some of the requests going from the client might be unique, but at some point, repetitive pattern requests can be seen and it will be imitated with a loop logic. Additionally, this repetitive pattern usually has a constant interval between requests, which might need to be taken into account.

![](/files/-McheeGvKEgn5tsebxwa)

That's it, happy testing!

{% content-ref url="/pages/-MUSAunBwe2J09CIl1hu" %}
[JMeter Test](/create-test/jmeter-test)
{% endcontent-ref %}

If you don't see the answer to your question here, please [reach out to us](https://loadium.com/contact-us/) to let us know! We're always improving our documentation.


# JMeter Timers old

## Why Do I Need a Timer in JMeter?

User behavior in [load tests](https://loadium.com/blog/record-and-play-load-testing-in-5-steps/) depends on many factors. Those factors can be “ramp-up time”, “user count on the system in a specific time interval”, etc. and most of them rely on timing. **The time between user actions defines the realism of the scenario.** That’s why JMeter offers various Timer for you to use in your performance test projects.

By default, [JMeter](https://loadium.com/blog/websocket-with-apache-jmeter/) executes all samplers one after another. There is no delay between sampler’s execution. This makes our tests non-realistic because no user goes into a page and clicks to a link, then does another request. A user thinks, reads, writes in a web or mobile app. So all those times are the key characteristic of your scenario. In [performance testing](https://loadium.com/blog/performance-testing-with-postman/), this is called “**think time**”. Testing without a [JMeter](https://loadium.com/blog/handling-error-messages-of-jmeter-tests-in-loadium/) timer can create irregular test results because the simulated requests will come in a different pattern than what is seen in a real-world situation.

## Timer Types

In JMeter, there are 9 different Timer types.

1. Constant Timer
2. Uniform Random Timer
3. Precise Throughput Timer
4. Constant Throughput Timer
5. Gaussian Random Timer
6. JRS223 Timer
7. Poisson Random Timer
8. Synchronizing Timer
9. BeanShell Timer

Each timer has its own behavior. Let’s have a look at some major Timers.

**Constant Timer:**  This is the most basic timer [JMeter](https://loadium.com/blog/tag/jmeter/) provides. All Samplers will wait a constant time interval according to the value you provided. The thread delay is in milliseconds.

**Uniform Random Timer:**  This timer lets your Samplers wait in a specific time interval according to the given values. You should provide two values. First one is the constant delay, the second one is the random delay.

{% hint style="success" %}
***Example***

Constant Time: 500ms

Random Delay: 100ms

Our samplers will wait x amount of milliseconds between 400ms and 600ms.
{% endhint %}

**Gaussian Random Timer:** It follows a normal or Gaussian distribution method. It provides a delay based on a constant and standard deviation.

**JRS223 Timer and BeanShell Timers:** They both require you to write some scripts by using javascript, groovy or [BeanShell](https://loadium.com/blog/beanshell-processor-tutorial-1-basic-usage/) scripting language.

## How to Use Timers

We recommend you to use scoping articles that we recently published. [Scopes in JMeter](https://loadium.com/blog/scopes-in-jmeter/)

There are examples that you can look into.

Happy [load testing](https://loadium.com/blog/benefits-of-load-testing-on-the-cloud/)!

{% content-ref url="/pages/-MUQ5cTQeTV9Yioro2zC" %}
[Getting Started with Loadium](/getting-started)
{% endcontent-ref %}

{% content-ref url="/pages/-MUSAunBwe2J09CIl1hu" %}
[JMeter Test](/create-test/jmeter-test)
{% endcontent-ref %}

{% content-ref url="/pages/-MUT5hLDUtoTsSYDaFkV" %}
[Pricing OLD](/about-loadium/pricingold)
{% endcontent-ref %}

If you don't see the answer to your question here, please [reach out to us](https://loadium.com/contact-us/) to let us know! We're always improving our documentation.


# JMeter Timers

## Why Do I Need a Timer in JMeter?

User behavior in [load tests](https://loadium.com/blog/record-and-play-load-testing-in-5-steps/) depends on many factors. Those factors can be “ramp-up time”, “user count on the system in a specific time interval”, etc. and most of them rely on timing. **The time between user actions defines the realism of the scenario.** That’s why JMeter offers various Timer for you to use in your performance test projects.

By default, [JMeter](https://loadium.com/blog/websocket-with-apache-jmeter/) executes all samplers one after another. There is no delay between sampler’s execution. This makes our tests non-realistic because no user goes into a page and clicks to a link, then does another request. A user thinks, reads, writes in a web or mobile app. So all those times are the key characteristic of your scenario. In [performance testing](https://loadium.com/blog/performance-testing-with-postman/), this is called “**think time**”. Testing without a [JMeter](https://loadium.com/blog/handling-error-messages-of-jmeter-tests-in-loadium/) timer can create irregular test results because the simulated requests will come in a different pattern than what is seen in a real-world situation.

## Timer Types

In JMeter, there are 9 different Timer types.

1. Constant Timer
2. Uniform Random Timer
3. Precise Throughput Timer
4. Constant Throughput Timer
5. Gaussian Random Timer
6. JRS223 Timer
7. Poisson Random Timer
8. Synchronizing Timer
9. BeanShell Timer

Each timer has its own behavior. Let’s have a look at some major Timers.

**Constant Timer:**  This is the most basic timer [JMeter](https://loadium.com/blog/tag/jmeter/) provides. All Samplers will wait a constant time interval according to the value you provided. The thread delay is in milliseconds.

**Uniform Random Timer:** This timer makes the sampler wait for a duration calculated as the **constant delay plus a random value between 0 and the specified random delay**.

{% hint style="success" %}
***Example***

Constant Delay: 500 ms\
Random Delay: 100 ms

JMeter will pause the sampler for a random duration between 500 ms and 600 ms.
{% endhint %}

**Gaussian Random Timer:** It follows a normal or Gaussian distribution method. It provides a delay based on a constant and standard deviation.

**JRS223 Timer and BeanShell Timers:** They both require you to write some scripts by using javascript, groovy or [BeanShell](https://loadium.com/blog/beanshell-processor-tutorial-1-basic-usage/) scripting language.

## How to Use Timers

We recommend you to use scoping articles that we recently published. [Scopes in JMeter](https://loadium.com/blog/scopes-in-jmeter/)

There are examples that you can look into.

Happy [load testing](https://loadium.com/blog/benefits-of-load-testing-on-the-cloud/)!

{% content-ref url="/pages/-MUQ5cTQeTV9Yioro2zC" %}
[Getting Started with Loadium](/getting-started)
{% endcontent-ref %}

{% content-ref url="/pages/-MUSAunBwe2J09CIl1hu" %}
[JMeter Test](/create-test/jmeter-test)
{% endcontent-ref %}

{% content-ref url="/pages/MgN0OAuKVZtI6DuNx1bd" %}
[Pricing](/about-loadium/pricing)
{% endcontent-ref %}

If you don't see the answer to your question here, please [reach out to us](https://loadium.com/contact-us/) to let us know! We're always improving our documentation.


# Handling Error Messages of JMeter Tests in Loadium old

Errors found during [testing](https://loadium.com/blog/functional-testing-with-loadium-apache-jmeter/) is a part of the process, [tests](https://loadium.com/blog/record-and-play-load-testing-in-5-steps/) are done to find them after all. After finding an error, understanding its reason is crucial. Some errors are easy to understand and recognize if they reveal themselves clearly, but sometimes errors are hard to detect and if their reason isn’t clear it might even lead to more confusing results.

There might be several reasons for an error to occur. It could be due to a logical error in the script, or while the script is doing its work properly, server might mess up when processing it.

## Jmeter Functions

[JMeter](https://loadium.com/blog/how-to-add-a-variable-number-of-parameters-in-apache-jmeter/) has a built-in functionality that allows us to handle error messages. Since [JMeter](https://loadium.com/blog/in-depth-analysis-throughput-controller-in-jmeter-and-splitting-threads-to-requests/) is a Java application which is an OOP language, there is access to some objects that come in handy. One of them is the “Prev” class’ “prev” object that allows us to do workarounds for error messages, which you can find the complete documentation here:

<https://jmeter.apache.org/api/org/apache/jmeter/samplers/SampleResult.html>

Let’s take a look at some methods from this class:

* getResponseCode() – Returns the last executed sample’s response code
* setResponseCode() – Sets a custom response code to the last executed sample
* getResponseDataAsString() – Returns the last executed sample’s response body

By using only these 3 methods, we can easily handle the error messages.

## Example Case

Sometimes the message contained in the response code or the code itself isn’t self-explanatory enough. Likewise, there may be more detailed information of the error in the response body, and since what’s included in the body by default is not available to be seen in the report screen “Error” page, a configuration can be done to make it visible.

For example, the response error message “Internal Server Error” does not show the reason clearly, and if there is a possibility that its body contains information about the error, it is better for it to be shown here. For this, we can make a configuration in a JSR223 PostProcessor like the following:

![](/files/-Mci8YzdU7Lyy3uxWYkV)

And with the function:

`if(prev.getResponseCode() == "500"){`\
`prev.setResponseMessage(prev.getResponseDataAsString());`

In Jmeter, instead of standart "Internal Server Error" message, we will get a message as shown below:

![](/files/-Mci9UNWutLHtkRWGlVF)

While in Loadium Report Screen, we will get the following result in Response Codes Page or Errors Page:

![](/files/-Mci8pK3yxj7hrtKvg5M)

Happy testing!

{% content-ref url="/pages/-MUSAunBwe2J09CIl1hu" %}
[JMeter Test](/create-test/jmeter-test)
{% endcontent-ref %}

If you don't see the answer to your question here, please [reach out to us](https://loadium.com/contact-us/) to let us know! We're always improving our documentation.


# Handling Error Messages of JMeter Tests in Loadium

Errors found during [testing](https://loadium.com/blog/functional-testing-with-loadium-apache-jmeter/) is a part of the process, [tests](https://loadium.com/blog/record-and-play-load-testing-in-5-steps/) are done to find them after all. After finding an error, understanding its reason is crucial. Some errors are easy to understand and recognize if they reveal themselves clearly, but sometimes errors are hard to detect and if their reason isn’t clear it might even lead to more confusing results.

There might be several reasons for an error to occur. It could be due to a logical error in the script, or while the script is doing its work properly, server might mess up when processing it.

## Jmeter Functions

[JMeter](https://loadium.com/blog/how-to-add-a-variable-number-of-parameters-in-apache-jmeter/) has a built-in functionality that allows us to handle error messages. Since [JMeter](https://loadium.com/blog/in-depth-analysis-throughput-controller-in-jmeter-and-splitting-threads-to-requests/) is a Java application which is an OOP language, there is access to some objects that come in handy. One of them is the “Prev” class’ “prev” object that allows us to do workarounds for error messages, which you can find the complete documentation here:

<https://jmeter.apache.org/api/org/apache/jmeter/samplers/SampleResult.html>

Let’s take a look at some methods from this class:

* getResponseCode() – Returns the last executed sample’s response code
* setResponseCode() – Sets a custom response code to the last executed sample
* getResponseDataAsString() – Returns the last executed sample’s response body

By using only these 3 methods, we can easily handle the error messages.

## Example Case

Sometimes the message contained in the response code or the code itself isn’t self-explanatory enough. Likewise, there may be more detailed information of the error in the response body, and since what’s included in the body by default is not available to be seen in the report screen “Error” page, a configuration can be done to make it visible.

For example, the response error message “Internal Server Error” does not show the reason clearly, and if there is a possibility that its body contains information about the error, it is better for it to be shown here. For this, we can make a configuration in a JSR223 PostProcessor like the following:

![](/files/-Mci8YzdU7Lyy3uxWYkV)

And with the function:

`if(prev.getResponseCode() == "500"){`\
`prev.setResponseMessage(prev.getResponseDataAsString());`

In Jmeter, instead of standart "Internal Server Error" message, we will get a message as shown below:

![](/files/-Mci9UNWutLHtkRWGlVF)

While in Loadium Report Screen, we will get the following result in Response Codes Page or Errors Page:

<figure><img src="/files/NotKJlB8TehFptyIumjk" alt=""><figcaption></figcaption></figure>

Happy testing!

{% content-ref url="/pages/-MUSAunBwe2J09CIl1hu" %}
[JMeter Test](/create-test/jmeter-test)
{% endcontent-ref %}

If you don't see the answer to your question here, please [reach out to us](https://loadium.com/contact-us/) to let us know! We're always improving our documentation.


# Details of Throughput Controller in JMeter (Splitting Threads to Different Requests) old

## **What is Throughput?**

Throughput, essentially, is the number of requests executed per unit of time. It is one of the basic concepts of [performance testing](https://loadium.com/blog/tag/performance-testing/). Since the main subject here is “performance”, a term that features a measurement of “per unit of time” makes it an important one.

In performance tests, there will be a lot of requests going on in a short period of time in order to apply necessary stress to the desired servers. However, not every server in a system has an equal priority or necessity to apply stress. One of the servers might be called more frequently than others. For example, for an e-commerce website, a server that is responsible for completing a transaction will have much more [load](https://loadium.com/blog/campaign-periods-key-to-success-load-test/) in general compared to the one that is responsible for creating an account. Therefore, it is unnecessary to apply the same load for every page, instead, the load should be split or even prevented from some servers. Generally, for this purpose, a tool in [JMeter](https://loadium.com/blog/using-commandline-parameters-in-jmeter/) called “throughput controller” is used, however, this tool could sometimes lead to logical errors in the script.

## **How Throughput Controller Works**

What the throughput controller basically does is; controlling the execution amount for its child requests. For example, in a script where a request is going to be called 100 times in total, it can be reduced up to 50 times with a throughput controller that has a 50% execution parameter. One thing worth mentioning, which is also mentioned in JMeter’s documentation; is that the throughput controller does not indicate exactly what its name implies, which is “requests executed per unit of time”. Instead, it does not have control over “per unit of time”, but this functionality is still somewhat parallel to what is usually wanted to perform, which is limiting the specific request’s execution amount.

For a more detailed examination of how throughput controller controls execution times, let’s illustrate it with an example:

Let’s say we have a number of threads (virtual-users) set to 10 and add two throughput controllers with 50% execution. First one; “Letters”, and second one; “Numbers”. With this setup, JMeter will try to execute requests “A” and “1” 5 times each.

<img src="/files/-MciNcWsgTyTuxofKmA5" alt="" data-size="original">

What is important here is, if we take a look at the results of the execution, it can be seen that Thread#2 has executed both requests; “A” from “Letters”, and “1” from “Numbers”.

![](/files/-MciURI2HQ63YQ0xjpQg)

This means that, if we have a script which passes crucial information (variables) between the requests in order to execute another request, this behavior of JMeter may cause a logical error in the script.

For instance, let’s say we have a script for an e-commerce website, and we want to distribute users by paying online and paying on delivery.

<img src="/files/-MciX-fGLFpfoWopbGAx" alt="" data-size="original">

Information of credit card will be required for paying online, and information of the person who is picking up the package will be required for paying on delivery. Furthermore, this information will be managed in the script by executing different requests with different parameters for each paying type. Therefore if we were to distribute users with only throughput [controller](https://loadium.com/blog/module-controller/), there is a possibility that thread#1, (let’s say online payer), which has information of a credit card stored in its variable will be executing a request for paying on delivery, which will cause an error in the script, and vice versa. Since the throughput controller’s purpose is to distribute execution amount with the given parameters by selecting threads almost randomly, it will be ignoring the logical errors occurring in the script.

## **Alternatives / Solutions**

One alternative can be using a switch controller instead, and design it to act like a throughput controller. For this, we need to create a .csv file for switch controller to make it act like it randomly selects its child nodes, with respect to execution amounts we want it to achieve.<img src="/files/-MciXi4f_gleHL6npFvk" alt="" data-size="original">                 .csv file:<img src="/files/-MciXxyrWMUMm8pqLNHu" alt="" data-size="original">

With this .csv file, the switch controller will be executing “Paying Online” and “Paying On Delivery” 5 times each, and the order can certainly be randomized if needed to achieve more realistic simulation. Moreover, with this script design, the threads will be following one of either path; “Paying Online” or “Paying on Delivery”.

## **When Should I Use Throughput Controller?**

As long as there isn’t a transfer of crucial information between requests, or probability that some logical error might occur, using the throughput controller should not cause an issue.

Happy testing!

{% content-ref url="/pages/-MUT6iOSA6kWcHdMz1am" %}
[Features](/about-loadium/features)
{% endcontent-ref %}

{% content-ref url="/pages/-MUQ5cTQeTV9Yioro2zC" %}
[Getting Started with Loadium](/getting-started)
{% endcontent-ref %}

{% content-ref url="/pages/-MUSAunBwe2J09CIl1hu" %}
[JMeter Test](/create-test/jmeter-test)
{% endcontent-ref %}

{% content-ref url="/pages/-MUT5hLDUtoTsSYDaFkV" %}
[Pricing OLD](/about-loadium/pricingold)
{% endcontent-ref %}

If you don't see the answer to your question here, please [reach out to us](https://loadium.com/contact-us/) to let us know! We're always improving our documentation.


# Details of Throughput Controller in JMeter (Splitting Threads to Different Requests)

## **What is Throughput?**

Throughput, essentially, is the number of requests executed per unit of time. It is one of the basic concepts of [performance testing](https://loadium.com/blog/tag/performance-testing/). Since the main subject here is “performance”, a term that features a measurement of “per unit of time” makes it an important one.

In performance tests, there will be a lot of requests going on in a short period of time in order to apply necessary stress to the desired servers. However, not every server in a system has an equal priority or necessity to apply stress. One of the servers might be called more frequently than others. For example, for an e-commerce website, a server that is responsible for completing a transaction will have much more [load](https://loadium.com/blog/campaign-periods-key-to-success-load-test/) in general compared to the one that is responsible for creating an account. Therefore, it is unnecessary to apply the same load for every page, instead, the load should be split or even prevented from some servers. Generally, for this purpose, a tool in [JMeter](https://loadium.com/blog/using-commandline-parameters-in-jmeter/) called “throughput controller” is used, however, this tool could sometimes lead to logical errors in the script.

## **How Throughput Controller Works**

What the throughput controller basically does is; controlling the execution amount for its child requests. For example, in a script where a request is going to be called 100 times in total, it can be reduced up to 50 times with a throughput controller that has a 50% execution parameter. One thing worth mentioning, which is also mentioned in JMeter’s documentation; is that the throughput controller does not indicate exactly what its name implies, which is “requests executed per unit of time”. Instead, it does not have control over “per unit of time”, but this functionality is still somewhat parallel to what is usually wanted to perform, which is limiting the specific request’s execution amount.

For a more detailed examination of how throughput controller controls execution times, let’s illustrate it with an example:

Let’s say we have a number of threads (virtual-users) set to 10 and add two throughput controllers with 50% execution. First one; “Letters”, and second one; “Numbers”. With this setup, JMeter will try to execute requests “A” and “1” 5 times each.

<p align="center"><img src="/files/-MciNcWsgTyTuxofKmA5" alt="" data-size="original"></p>

What is important here is, if we take a look at the results of the execution, it can be seen that Thread#2 has executed both requests; “A” from “Letters”, and “1” from “Numbers”.

![](/files/-MciURI2HQ63YQ0xjpQg)

This means that, if we have a script which passes crucial information (variables) between the requests in order to execute another request, this behavior of JMeter may cause a logical error in the script.

For instance, let’s say we have a script for an e-commerce website, and we want to distribute users by paying online and paying on delivery.

<p align="center"><img src="/files/-MciX-fGLFpfoWopbGAx" alt="" data-size="original"></p>

Information of credit card will be required for paying online, and information of the person who is picking up the package will be required for paying on delivery. Furthermore, this information will be managed in the script by executing different requests with different parameters for each paying type. Therefore if we were to distribute users with only throughput [controller](https://loadium.com/blog/module-controller/), there is a possibility that thread#1, (let’s say online payer), which has information of a credit card stored in its variable will be executing a request for paying on delivery, which will cause an error in the script, and vice versa. Since the throughput controller’s purpose is to distribute execution amount with the given parameters by selecting threads almost randomly, it will be ignoring the logical errors occurring in the script.

## **Alternatives / Solutions**

One alternative can be using a switch controller instead, and design it to act like a throughput controller. For this, we need to create a .csv file for switch controller to make it act like it randomly selects its child nodes, with respect to execution amounts we want it to achieve.

<figure><img src="/files/-MciXi4f_gleHL6npFvk" alt=""><figcaption><p>CSV File configuration</p></figcaption></figure>

<figure><img src="/files/-MciXxyrWMUMm8pqLNHu" alt=""><figcaption><p>Contents of CSV File</p></figcaption></figure>

With this .csv file, the switch controller will be executing “Paying Online” and “Paying On Delivery” 5 times each, and the order can certainly be randomized if needed to achieve more realistic simulation. Moreover, with this script design, the threads will be following one of either path; “Paying Online” or “Paying on Delivery”.

## **When Should I Use Throughput Controller?**

As long as there isn’t a transfer of crucial information between requests, or probability that some logical error might occur, using the throughput controller should not cause an issue.

Happy testing!

{% content-ref url="/pages/-MUT6iOSA6kWcHdMz1am" %}
[Features](/about-loadium/features)
{% endcontent-ref %}

{% content-ref url="/pages/-MUQ5cTQeTV9Yioro2zC" %}
[Getting Started with Loadium](/getting-started)
{% endcontent-ref %}

{% content-ref url="/pages/-MUSAunBwe2J09CIl1hu" %}
[JMeter Test](/create-test/jmeter-test)
{% endcontent-ref %}

{% content-ref url="/pages/MgN0OAuKVZtI6DuNx1bd" %}
[Pricing](/about-loadium/pricing)
{% endcontent-ref %}

If you don't see the answer to your question here, please [reach out to us](https://loadium.com/contact-us/) to let us know! We're always improving our documentation.


# How to Add a Varying Number of Parameters in Apache JMeter

Some requests have more than one parameter, and the number of parameters may change. You can also add dynamic parameters according to your scenario.

To resolve this issue, JSR223 PreProcessor provided by [JMeter](https://loadium.com/blog/functional-testing-with-loadium-apache-jmeter/) can be used.

First, we add an [HTTP request](https://loadium.com/blog/4-things-you-should-know-about-http-requests/) as shown below, then **we delete all the parameters** and add JSR223 [PreProcessor](https://loadium.com/blog/how-to-add-a-variable-number-of-parameters-in-apache-jmeter/).

![](/files/-MciDqIiLlSaMQ6tYiGV)

In this example, we choose the groovy language.

Then we add a for loop to determine how many parameters we will add, and add the parameter insert code to use it inside the for a loop.

`for(int i=1; i<=10; i++){sampler.AddArgument("ParameterName"+i, "Value"+i);}`

![](/files/-MciDyvYPtc2h9EkXD1u)

When we run the [test](https://loadium.com/blog/jmeter-distributed-testing-step-by-step/), we add any number of parameters as shown in the figure.

![](/files/-MciF6YSr1QFrKCBLIDt)

Happy testing!

{% content-ref url="/pages/-MUT6iOSA6kWcHdMz1am" %}
[Features](/about-loadium/features)
{% endcontent-ref %}

{% content-ref url="/pages/-MUQ5cTQeTV9Yioro2zC" %}
[Getting Started with Loadium](/getting-started)
{% endcontent-ref %}

{% content-ref url="/pages/-MUSAunBwe2J09CIl1hu" %}
[JMeter Test](/create-test/jmeter-test)
{% endcontent-ref %}

{% content-ref url="/pages/MgN0OAuKVZtI6DuNx1bd" %}
[Pricing](/about-loadium/pricing)
{% endcontent-ref %}

If you don't see the answer to your question here, please [reach out to us](https://loadium.com/contact-us/) to let us know! We're always improving our documentation.


# Local Network Simulation On JMeter old

For the recent years, mobile had overtaken desktop traffic. It seems that this trend will continue to rise. But does it change in our lives? That means that our users are on the move. They are not sitting in their comfortable chairs and take benefit of great DSL network speeds.

In most cases, mobile device users access the internet via their cellular operator network. The speed, reliability varies depending on the location of the user. You’ll realize that it’s always changing. That means speed varies mostly during the day. So we need to make sure that websites or mobile application work on every condition without affecting the user experience with functional and non-functional aspects in different internet connection speeds.

## How to Simulate Different Network Speeds?

By default, [JMeter](https://loadium.com/blog/websocket-with-apache-jmeter/) sends all requests defined in a Test Plan as fast as it could, depending on the local computer that you are working on. This is incredibly important for producing the load effectively but from a user side, it is not very realistic. As real users don’t send requests to the server without taking a breath, they also spend some time to think between any operations. Besides that, mobile users have limited network bandwidth and that limits them to make requests at the slower speed. So mobile [performance testing](https://loadium.com/blog/performance-testing-terminology/) scripts should mimic the network type.

In your jmeter.properties file, there are two properties that define the bandwidth type that you use during your [performance tests](https://loadium.com/blog/tag/performance-testing/). Those properties are\
`httpclient.socket.http.cps=0`\
`httpclient.socket.https.cps=0`\
\
One is for HTTP, the other one is for HTTPS requests. CPS stands for “**Character per second**”. When all those values are set to zero, it means there is no limit. No limit means no waiting. When those values are set to some other value, it means that the bandwidth throttle according to the value that you specified.

CPS Calculation Formula is:

**cps = (target bandwidth in kbps \* 1024) / 8**

For example: to emulate the Mobile EDGE cellular network speed (which is 384 Kbits/second downstream), the relevant CPS value would be: 49152 (384 \* 1024 / 8)

Then go to your jmeter.properties file and set the cps values.\
`httpclient.socket.http.cps=21888`\
`httpclient.socket.https.cps=21888`\
In case you don’t want to mess up with all those setting files, you can use the command line to manipulate those values on runtime. Below is the command for it.\
`jmeter -Jhttpclient.socket.http.cps=21888 -Jhttpclient.socket.https.cps=21888 -t /performancescript.jmx`\
Here are some popular bandwidth presets:

| **Bandwidth**                  | **cps Value** |
| ------------------------------ | ------------- |
| Mobile data GPRS : 171 kbit/s  | 21888         |
| Mobile data EDGE : 384 kbit/s  | 49152         |
| Mobile data HSPA : 14,4 Mbp/s  | 1843200       |
| Mobile data HSPA+ : 21 Mbp/s   | 2688000       |
| Mobile data DC-HSPA+ : 42 Mbps | 5376000       |
| Mobile data LTE : 150 Mbp/s    | 19200000      |
| WIFI 802.11a/g : 54 Mbit/s     | 6912000       |

[Loadium](https://loadium.com/blog/functional-testing-with-loadium-apache-jmeter/) allows you to manipulate those values before the test run.

![](/files/-MciZpATIj0hLyUy0sMx)

You can set different bandwidth type for all the engines. So you can create a realistic load with the different type of bandwidth usage. Don’t forget that this kind of configurations are very useful when it comes to [testing](https://loadium.com/blog/functional-testing-with-loadium-apache-jmeter/) Black Friday, Cyber Monday scenarios.

![](/files/-Mci_-GWdW5xkyb4Ojvn)

Happy testing!

{% content-ref url="/pages/-MUQ5cTQeTV9Yioro2zC" %}
[Getting Started with Loadium](/getting-started)
{% endcontent-ref %}

{% content-ref url="/pages/-MUSAunBwe2J09CIl1hu" %}
[JMeter Test](/create-test/jmeter-test)
{% endcontent-ref %}

{% content-ref url="/pages/-MUT5hLDUtoTsSYDaFkV" %}
[Pricing OLD](/about-loadium/pricingold)
{% endcontent-ref %}

If you don't see the answer to your question here, please [reach out to us](https://loadium.com/contact-us/) to let us know! We're always improving our documentation.


# Local Network Simulation On JMeter

For the recent years, mobile had overtaken desktop traffic. It seems that this trend will continue to rise. But does it change in our lives? That means that our users are on the move. They are not sitting in their comfortable chairs and take benefit of great DSL network speeds.

In most cases, mobile device users access the internet via their cellular operator network. The speed, reliability varies depending on the location of the user. You’ll realize that it’s always changing. That means speed varies mostly during the day. So we need to make sure that websites or mobile application work on every condition without affecting the user experience with functional and non-functional aspects in different internet connection speeds.

## How to Simulate Different Network Speeds?

By default, [JMeter](https://loadium.com/blog/websocket-with-apache-jmeter/) sends all requests defined in a Test Plan as fast as it could, depending on the local computer that you are working on. This is incredibly important for producing the load effectively but from a user side, it is not very realistic. As real users don’t send requests to the server without taking a breath, they also spend some time to think between any operations. Besides that, mobile users have limited network bandwidth and that limits them to make requests at the slower speed. So mobile [performance testing](https://loadium.com/blog/performance-testing-terminology/) scripts should mimic the network type.

In your jmeter.properties file, there are two properties that define the bandwidth type that you use during your [performance tests](https://loadium.com/blog/tag/performance-testing/). Those properties are\
`httpclient.socket.http.cps=0`\
`httpclient.socket.https.cps=0`\
\
One is for HTTP, the other one is for HTTPS requests. CPS stands for “**Character per second**”. When all those values are set to zero, it means there is no limit. No limit means no waiting. When those values are set to some other value, it means that the bandwidth throttle according to the value that you specified.

CPS Calculation Formula is:

**cps = (target bandwidth in kbps \* 1024) / 8**

For example: to emulate the Mobile EDGE cellular network speed (which is 384 Kbits/second downstream), the relevant CPS value would be: 49152 (384 \* 1024 / 8)

Then go to your jmeter.properties file and set the cps values.\
`httpclient.socket.http.cps=21888`\
`httpclient.socket.https.cps=21888`\
In case you don’t want to mess up with all those setting files, you can use the command line to manipulate those values on runtime. Below is the command for it.\
`jmeter -Jhttpclient.socket.http.cps=21888 -Jhttpclient.socket.https.cps=21888 -t /performancescript.jmx`\
Here are some popular bandwidth presets:

| **Bandwidth**                  | **cps Value** |
| ------------------------------ | ------------- |
| Mobile data GPRS : 171 kbit/s  | 21888         |
| Mobile data EDGE : 384 kbit/s  | 49152         |
| Mobile data HSPA : 14,4 Mbp/s  | 1843200       |
| Mobile data HSPA+ : 21 Mbp/s   | 2688000       |
| Mobile data DC-HSPA+ : 42 Mbps | 5376000       |
| Mobile data LTE : 150 Mbp/s    | 19200000      |
| WIFI 802.11a/g : 54 Mbit/s     | 6912000       |

[Loadium](https://loadium.com/blog/functional-testing-with-loadium-apache-jmeter/) allows you to manipulate those values before the test run.

<figure><img src="/files/YJGkFmpsJubel6ymotKc" alt=""><figcaption></figcaption></figure>

You can set different bandwidth type for all the engines. So you can create a realistic load with the different type of bandwidth usage. Don’t forget that this kind of configurations are very useful when it comes to [testing](https://loadium.com/blog/functional-testing-with-loadium-apache-jmeter/) Black Friday, Cyber Monday scenarios.

<figure><img src="/files/7pjXhSlTj8t7yLeGiruv" alt=""><figcaption><p>Available Bandwith Configurations</p></figcaption></figure>

Happy testing!

{% content-ref url="/pages/-MUQ5cTQeTV9Yioro2zC" %}
[Getting Started with Loadium](/getting-started)
{% endcontent-ref %}

{% content-ref url="/pages/-MUSAunBwe2J09CIl1hu" %}
[JMeter Test](/create-test/jmeter-test)
{% endcontent-ref %}

{% content-ref url="/pages/MgN0OAuKVZtI6DuNx1bd" %}
[Pricing](/about-loadium/pricing)
{% endcontent-ref %}

If you don't see the answer to your question here, please [reach out to us](https://loadium.com/contact-us/) to let us know! We're always improving our documentation.


# Running Load Test with FTP Server

### What is FTP (File Transfer Protocol)&#x20;

FTP server is an application that allows files to be transferred from one computer to another. Files can be transferred to any computer over the Internet.&#x20;

FTP is a standard network protocol used for the transfer of files between a client and server on a computer network.&#x20;

![](https://firebasestorage.googleapis.com/v0/b/gitbook-x-prod.appspot.com/o/spaces%2F-MUOy4kHWrKkuqX5mhH7%2Fuploads%2FtXXB87x9n7ByWyGwED7e%2Ffile.png?alt=media)

### Why Do We Need to Load Test the FTP Server ?&#x20;

There may be slowdowns in network speeds, latency or server on the FTP server. File transfer can take minutes or hours when the FTP server starts to slow down or crashes. The effect can be much greater when there are large file shares via the FTP server.&#x20;

Load testing is needed to measure how much load the FTP server can withstand and to find bottlenecks.&#x20;

### How to Test FTP Servers with Jmeter?&#x20;

Add FTP Request Defaults (Test Plan -> Add -> Config Element -> FTP Request Defaults)&#x20;

![](https://firebasestorage.googleapis.com/v0/b/gitbook-x-prod.appspot.com/o/spaces%2F-MUOy4kHWrKkuqX5mhH7%2Fuploads%2F5v0F8QXdhJJ9zAQW9Zlc%2Ffile.png?alt=media)

FTP Request Defaults is not used to send an ftp FTP request. It is used to make the definitions in an FTP request. &#x20;

You can set the required elements for a test, as shown below. We are using the Server at ftp.domain.com, a sample FTP server running on the standard FTP port 21.&#x20;

![](https://firebasestorage.googleapis.com/v0/b/gitbook-x-prod.appspot.com/o/spaces%2F-MUOy4kHWrKkuqX5mhH7%2Fuploads%2Ft93JrjNtKPf01YSiIDB0%2Ffile.png?alt=media)

![](https://firebasestorage.googleapis.com/v0/b/gitbook-x-prod.appspot.com/o/spaces%2F-MUOy4kHWrKkuqX5mhH7%2Fuploads%2FoECRf0VjXUXpmyOyJdMe%2Ffile.png?alt=media)

Add FTP Request (Thread Group -> Add -> Sampler -> FTP Request)&#x20;

You need to add "FTP Request” to send an FTP request. &#x20;

We write the path to the file and the username and password of the FTP server as shown below. Since we defined it in "FTP Request Defaults" before, we do not need to define the "Server Name or IP" part again, so we leave this field blank.&#x20;

![](https://firebasestorage.googleapis.com/v0/b/gitbook-x-prod.appspot.com/o/spaces%2F-MUOy4kHWrKkuqX5mhH7%2Fuploads%2FM58YkdDmQqZuwUE0ssIp%2Ffile.png?alt=media)

Then we start the test.&#x20;

Enjoy testing!

{% content-ref url="/pages/-MUSAoEB7WKUP6OKgxHU" %}
[Quick Start](/creating-your-first-test)
{% endcontent-ref %}

{% content-ref url="/pages/-MUSAunBwe2J09CIl1hu" %}
[JMeter Test](/create-test/jmeter-test)
{% endcontent-ref %}

{% content-ref url="/pages/-MUT64e7K16MOCUe5UD3" %}
[VUH - Virtual User Hour](/about-loadium/vuh-virtual-user-hour)
{% endcontent-ref %}

If you don't see the answer to your question here, please [reach out to us](https://loadium.com/contact-us/) to let us know! We're always improving our documentation.


# Introduction to Gatling old

Gatling is an Open Source Performance Load Testing Tool for Running, Recording and Editing Load Test Automations in SCALA language.

## Installing Gatling

In order to download Gatling we’ll need to navigate to following link:

<https://repo1.maven.org/maven2/io/gatling/highcharts/gatling-charts-highcharts-bundle/3.5.1/gatling-charts-highcharts-bundle-3.5.1-bundle.zip>

Unzip the downloaded file and you’ll see executables in /bin folder.

## Gatling With Loadium

Loadium supports Gatling 3.5.1, Also you need an IDE (preferably IntelliJ IDEA) installed on your computer in order to write Scala simulations.

Once you logged in, you can easily start creating and configuring your Gatling test.

![](/files/-Mdzhbe_lkEhhdigEvvL)

You can find detailed information for using Gatling with Loadium [here](https://wiki.loadium.com/creating-test/gatling-test).

Enjoy load testing!

{% content-ref url="/pages/-Mdzir5FykITF2HYvKR1" %}
[Gatling Recorder old](/gatling-corner/gatling-recorder-old)
{% endcontent-ref %}

{% content-ref url="/pages/-MUSBc3iHQSjgBJ9Ppxx" %}
[Gatling Test](/create-test/gatling-test)
{% endcontent-ref %}

{% content-ref url="/pages/-MUT5hLBO28\_mZRXGWKF" %}
[ABOUT LOADIUM](/about-loadium/features)
{% endcontent-ref %}

{% content-ref url="/pages/-MUT5hLDUtoTsSYDaFkV" %}
[Pricing OLD](/about-loadium/pricingold)
{% endcontent-ref %}

If you don't see the answer to your question here, please [reach out to us](https://loadium.com/contact-us/) to let us know! We're always improving our documentation.


# Introduction to Gatling

Gatling is an Open Source Performance Load Testing Tool for Running, Recording and Editing Load Test Automations in SCALA language.

## Installing Gatling

In order to download Gatling we’ll need to navigate to following link:

<https://repo1.maven.org/maven2/io/gatling/highcharts/gatling-charts-highcharts-bundle/3.5.1/gatling-charts-highcharts-bundle-3.5.1-bundle.zip>

Unzip the downloaded file and you’ll see executables in /bin folder.

## Gatling With Loadium

Loadium supports Gatling 3.5.1, Also you need an IDE (preferably IntelliJ IDEA) installed on your computer in order to write Scala simulations.

Once you logged in, you can easily start creating and configuring your Gatling test.

<figure><img src="/files/RmyowbpFiD70gqIUwljE" alt=""><figcaption></figcaption></figure>

You can find detailed information for using Gatling with Loadium [here](https://wiki.loadium.com/creating-test/gatling-test).

Enjoy load testing!

{% content-ref url="/pages/-Mdzir5FykITF2HYvKR1" %}
[Gatling Recorder old](/gatling-corner/gatling-recorder-old)
{% endcontent-ref %}

{% content-ref url="/pages/-MUSBc3iHQSjgBJ9Ppxx" %}
[Gatling Test](/create-test/gatling-test)
{% endcontent-ref %}

{% content-ref url="/pages/-MUT5hLBO28\_mZRXGWKF" %}
[ABOUT LOADIUM](/about-loadium/features)
{% endcontent-ref %}

{% content-ref url="/pages/MgN0OAuKVZtI6DuNx1bd" %}
[Pricing](/about-loadium/pricing)
{% endcontent-ref %}

If you don't see the answer to your question here, please [reach out to us](https://loadium.com/contact-us/) to let us know! We're always improving our documentation.


# Gatling Recorder old

A guide on for using Gatling Recorder, and creating\&running a basic Gatling test

## Recording a Script

To start Gatling Recorder, open the terminal on your computer and navigate to Gatling's bin directory using “cd” command.

* If you’re on windows you’ll need to run: `recorder.bat`&#x20;
* On the macOS or Linux Based OS you need to execute: `Sh ./recorder.sh`

```
loadium@localhost:~ erdem$ cd ~
loadium@localhost:~ erdem$ cd Downloads/
loadium@localhost:Downloads erdem$ cd gatling-charts-highcharts-bundle-3.5.1
loadium@localhost:gatling-charts-highcharts-bundle-3.5.1 erdem$ cd bin/
loadium@localhost:bin erdem$ Sh ./recorder.sh
GATLING_HOME is set to /Users/erdem/Downloads/gatling-charts-highcharts-bundle-3.5.1
```

![](/files/-Mdzz51BAvZt6jBAvGXC)

### Using .HAR File

In order to record a .HAR file you need to open the Chrome developer tools, Navigate to Network Section and start recording.

![](/files/-Me--JJe6zkidx_zXD7F)

After that you can right click and choose the "Save All As Har with Content". This should generate a .HAR file to use with Gatling.

{% hint style="info" %}
**Keep in mind:** Loadium also supports HAR files and it can convert your HAR files to JMX and run your tests with provided HAR File.

&#x20;                                   <img src="/files/-Me-0LnKN3_LTu7a8_Ec" alt="" data-size="original">&#x20;
{% endhint %}

Gatling Recorder can convert your HAR files easily to Scala you can simply switch the recorder mode to HAR Converter and select the HAR file. When you click to start it’ll convert your HAR Gatling Compatible Scala Test.

![](/files/-Me-0jfFttAXNogdW4hL)

### HTTP(S) Proxy Recorder

In order to record your first script you need to import your CA to your browser, after that you can use the proxy recording with Gatling.

Oops! Here comes the error. When we tried to exporting the CA from Gatling Recorder we welcomed by a roadblock. Even if we tried to Generate CA button on the Recorder it didn’t generated anything.

Here comes the thinking…

What we are gonna do?

How to Generate Certificate Authority For Gatling Recorder Proxy?

It’s as simple as writing 2 liner code, in fact literally two line code!

* Open the terminal on macOS or Linux Machine and type the following codes and hit enter

```
openssl genrsa -des3 -out rootCA.key 4096
openssl req -x509 -new -nodes -key rootCA.key -sha256 -days 1024 -out rootCA.crt
```

There should be two files created such as rootCa.key and rootCA.crt

* Import the .crt file to your browser and change your proxy settings to localhost:8000

![Uploading the certificate to Firefox browser](/files/-Me-3rkL2_FmwOFZ2iPa)

* Select the HTTP mode as Certificate Authority. Use the rootCA.crt file for CA Certificate and rootCA.key for CA Private Key.

![](/files/-Me-1YczPtXQLWqBmB4M)

Click the start and you’re ready to go.

## Running the Test

Open the terminal on your computer and navigate to bin directory using “cd” command.

* If you’re on windows you’ll need to run: `gatling.bat`
* On the macOS or Linux Based OS you need to execute: `sh ./gatling.sh`

![](/files/-Me-83scICewIHvj6NE-)

As you see you’ll see the recorded script and the demo scripts every script has its own number you can simply enter 0 and Gatling will begin testing.

![](/files/-Me-8DCk6iijCMhjIpWo)

## Automatically Generated Reporting

When test complete you’ll see results as shown above. In the last line you’ll notice a local url you can find your dashboard report using that url and the dashboard report is look like this:

![](/files/-Me0Czc7loyj9IrciDyu)

Enjoy Gatling test!

{% content-ref url="/pages/-MUSBc3iHQSjgBJ9Ppxx" %}
[Gatling Test](/create-test/gatling-test)
{% endcontent-ref %}

If you don't see the answer to your question here, please [reach out to us](https://loadium.com/contact-us/) to let us know! We're always improving our documentation.


# Gatling Recorder

A guide on for using Gatling Recorder, and creating\&running a basic Gatling test

## Recording a Script

To start Gatling Recorder, open the terminal on your computer and navigate to Gatling's bin directory using “cd” command.

* If you’re on windows you’ll need to run: `recorder.bat`&#x20;
* On the macOS or Linux Based OS you need to execute: `Sh ./recorder.sh`

```
loadium@localhost:~ erdem$ cd ~
loadium@localhost:~ erdem$ cd Downloads/
loadium@localhost:Downloads erdem$ cd gatling-charts-highcharts-bundle-3.5.1
loadium@localhost:gatling-charts-highcharts-bundle-3.5.1 erdem$ cd bin/
loadium@localhost:bin erdem$ Sh ./recorder.sh
GATLING_HOME is set to /Users/erdem/Downloads/gatling-charts-highcharts-bundle-3.5.1
```

![](/files/-Mdzz51BAvZt6jBAvGXC)

### Using .HAR File

In order to record a .HAR file you need to open the Chrome developer tools, Navigate to Network Section and start recording.

<figure><img src="/files/dYsUat9PT6ndKRiXMXzF" alt=""><figcaption></figcaption></figure>

After that you can right click and choose the "Save All As Har with Content". This should generate a .HAR file to use with Gatling.

{% hint style="info" %}
**Keep in mind:** Loadium also supports HAR files and it can convert your HAR files to JMX and run your tests with provided HAR File. Check "Convert" tab for more info.

&#x20;                                    ![](/files/cfY5jotpwc2JABQbc4X4)
{% endhint %}

Gatling Recorder can convert your HAR files easily to Scala you can simply switch the recorder mode to HAR Converter and select the HAR file. When you click to start it’ll convert your HAR Gatling Compatible Scala Test.

![](/files/-Me-0jfFttAXNogdW4hL)

### HTTP(S) Proxy Recorder

In order to record your first script you need to import your CA to your browser, after that you can use the proxy recording with Gatling.

Oops! Here comes the error. When we tried to exporting the CA from Gatling Recorder we welcomed by a roadblock. Even if we tried to Generate CA button on the Recorder it didn’t generated anything.

Here comes the thinking…

What we are gonna do?

How to Generate Certificate Authority For Gatling Recorder Proxy?

It’s as simple as writing 2 liner code, in fact literally two line code!

* Open the terminal on macOS or Linux Machine and type the following codes and hit enter

```
openssl genrsa -des3 -out rootCA.key 4096
openssl req -x509 -new -nodes -key rootCA.key -sha256 -days 1024 -out rootCA.crt
```

There should be two files created such as rootCa.key and rootCA.crt

* Import the .crt file to your browser and change your proxy settings to localhost:8000

![Uploading the certificate to Firefox browser](/files/-Me-3rkL2_FmwOFZ2iPa)

* Select the HTTP mode as Certificate Authority. Use the rootCA.crt file for CA Certificate and rootCA.key for CA Private Key.

![](/files/-Me-1YczPtXQLWqBmB4M)

Click the start and you’re ready to go.

## Running the Test

Open the terminal on your computer and navigate to bin directory using “cd” command.

* If you’re on windows you’ll need to run: `gatling.bat`
* On the macOS or Linux Based OS you need to execute: `sh ./gatling.sh`

![](/files/-Me-83scICewIHvj6NE-)

As you see you’ll see the recorded script and the demo scripts every script has its own number you can simply enter 0 and Gatling will begin testing.

![](/files/-Me-8DCk6iijCMhjIpWo)

## Automatically Generated Reporting

When test complete you’ll see results as shown above. In the last line you’ll notice a local url you can find your dashboard report using that url and the dashboard report is look like this:

![](/files/-Me0Czc7loyj9IrciDyu)

Enjoy Gatling test!

{% content-ref url="/pages/-MUSBc3iHQSjgBJ9Ppxx" %}
[Gatling Test](/create-test/gatling-test)
{% endcontent-ref %}

If you don't see the answer to your question here, please [reach out to us](https://loadium.com/contact-us/) to let us know! We're always improving our documentation.


# Gatling Pros\&Cons

Among all the performance test tools, why do we use Gatling?. Let's take a look.

In a nutshell, Gatling has been a part of load-testing solutions for years. It’s performance efficient and cross-platform capabilities got many eyes' attention.

Gatling uses Scala language for writing tests. It’s immediately catching developer’s eyes while load testing their applications and projects.

Developers wants to code, don’t they? Gatling closes this gap between developers and testers. Both can use this tool simply and get familiar with it. This is one of the Gatling’s biggest advantage, providing this kind of adaptation.

Gatling is an open source load-testing tool, You can write your scripts using Scala language or you can simply convert your .Har dump from your browser and convert to Scala language. It can simulate thousands of users concurrently, and it has a basic reporting feature that allows you to take an additional look to test results.

Also Gatling provide you a GUI for recording your traffic and converting your .Har files to Scala script.

## Gatling Pros

### :green\_book:Detailed Reporting

After running your tests Gatling shows you a pretty detailed and colorful report that you can check connection times, response times, concurrent users etc.

### :green\_book:Load Test As Code

Gatling uses Scala language which is human readable DSL, This benefits for developers they can easy adapt the language.

### :green\_book:CI/CD Friendly

Any Gatling project that built using Maven or Gradle can easily integrate with CI/CD pipelines out of the box. This is very advantageous compared to other similar tools.

### :green\_book:Taurus, NewRelic etc. APM Integration

Performance testing means nothing without using any performance monitoring tools a.k.a APM’s. Gatling provides smooth integration with realtime tracking tools.

### :green\_book:Powerful

Gatling is really powerful tool, Uses Netty and Akka toolkit. While JMeter synchronous and slow, Gatling is asynchronous by its design. Gatling doesn’t allocating separate threads for each users. Which helps to simulate users by using one thread.

### :green\_book:Integrated API Assertions

Gatling’s integrated API assertions helps you to run different functional checks with your performance tests.

## Gatling Cons

### :closed\_book:Distributed Gatling Tests

Gatling Frontline helps you to scale your tests but it’s pricy. So if you want to scale with your tests with open sourced Gatling it’s not easy. While JMeter is easy to distribute your load tests, Gatling isn’t.

To distribute your Gatling tests you can create bash scripts for handling executors or you can easily distribute your tests using [Loadium](https://loadium.com/).

### :closed\_book:Poor Information During Execution

Gatling doesn’t provide much information during executing test, Instead of that it shows you a detailed report when you finish. But sometimes you need to see real-time data. This is why we gladly like to mention that Gatling is supported by [Loadium](https://loadium.com/), which allows you to monitor your Gatling tests easily.

### :closed\_book:Protocols Support

Gatling much more efficient than similar tools when it comes to threads and connections handling. However, Gatling supports much less protocols. Gatling only supports HTTP, Websocket, Serer-sent events and JMS.

In conclusion, Gatling is a really efficient tool for some protocols. If you need to use APM’s and CI/CD integrations Gatling is the best choice for you. Also keep in mind you can make pro from cons using [Loadium](https://loadium.com/)! :)

Happy load testing!